
Quarter End: What's next for $SPX
S&P has fourth worst three-quarter YTD return

Three-quarters of 2022 are in the books. The S&P 500 is down 24.77% YTD. Since 1921, this has been the 4th worst YTD performance for the S&P 500 after 3-quarters.
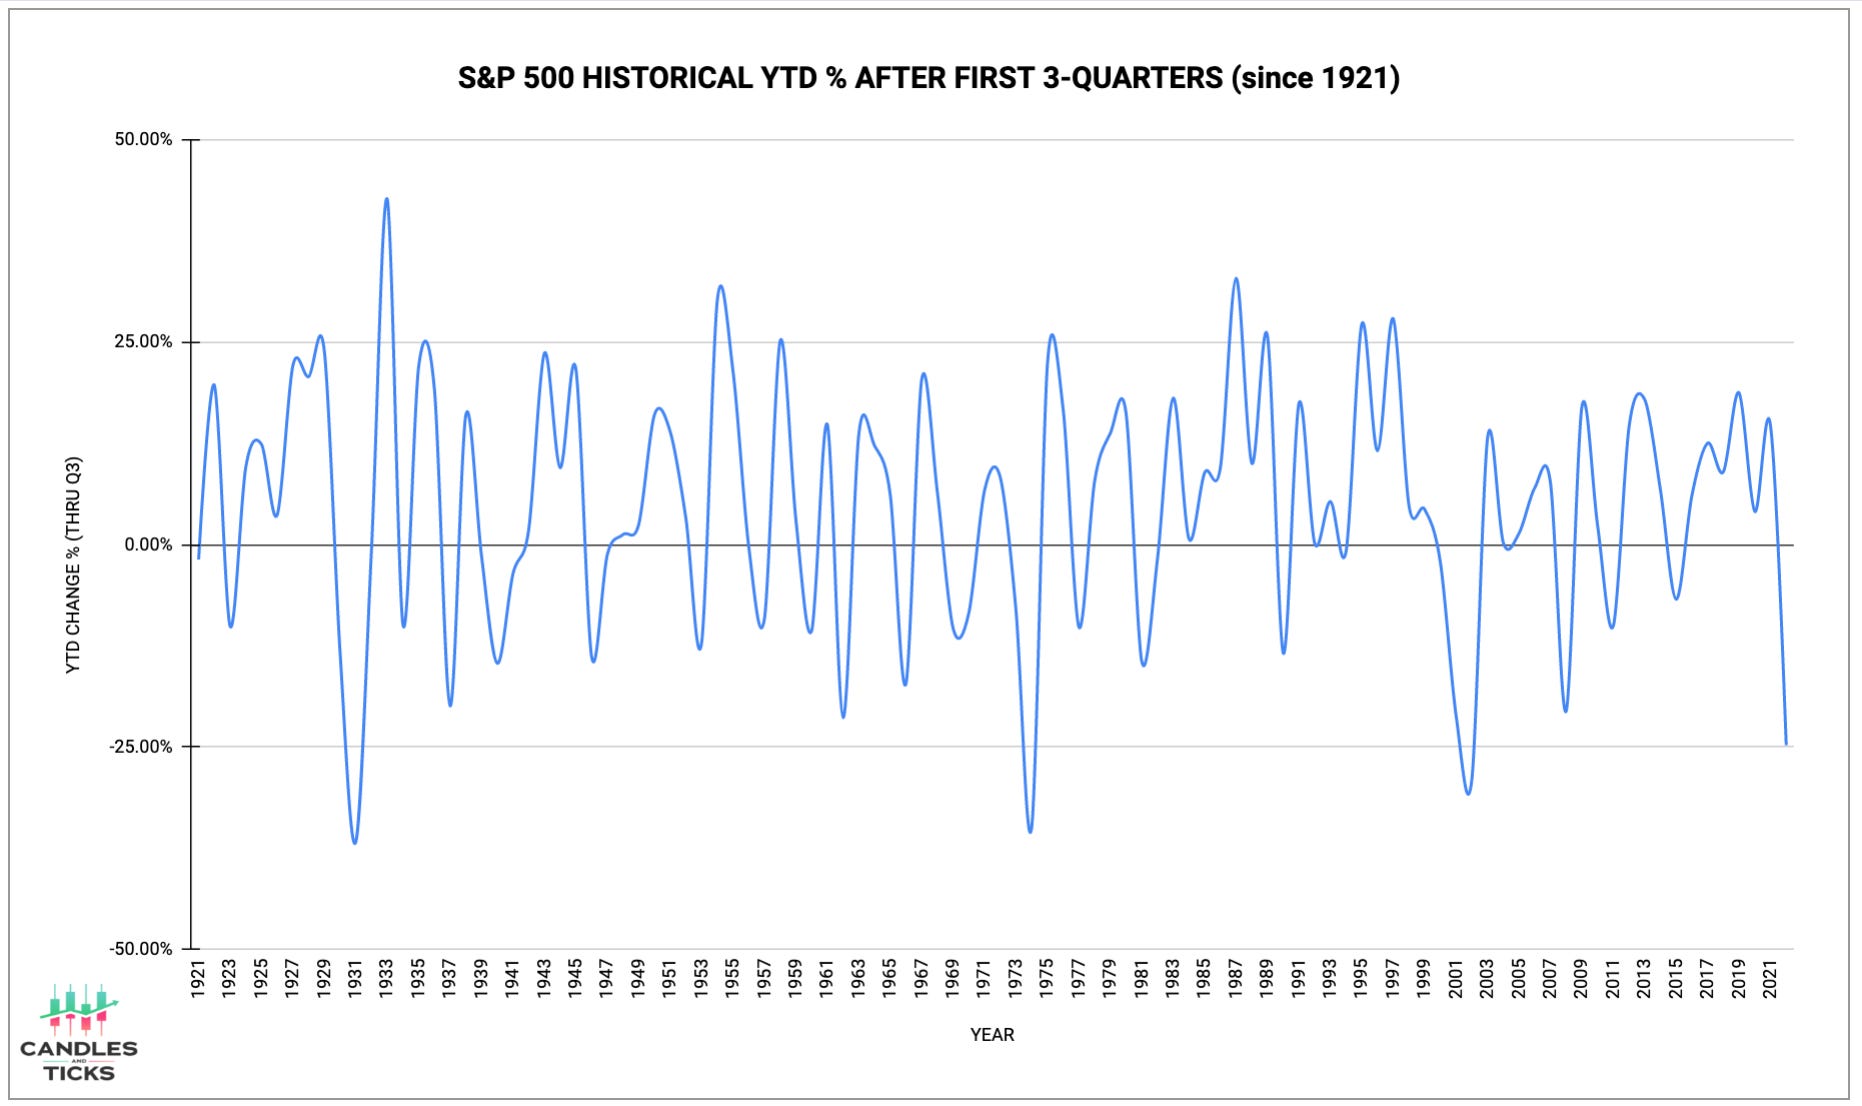
It’s also the 20th time Q3 has ended with a YTD decline of 10% or more. In the prior 19 instances:
13 declines of 10-20% (Q4 was positive 62% of the time)
4 declines of 20-30% (Q4 was positive 75% of the time)
2 declines of 30% or greater (Q4 was positive 50% of the time)

For Q3, itself, the index fell 5.28%. This is after being up by 10% at one point. According to Barchart, it’s the first time since 1938 that the S&P closed a quarter negative after being up 10%.

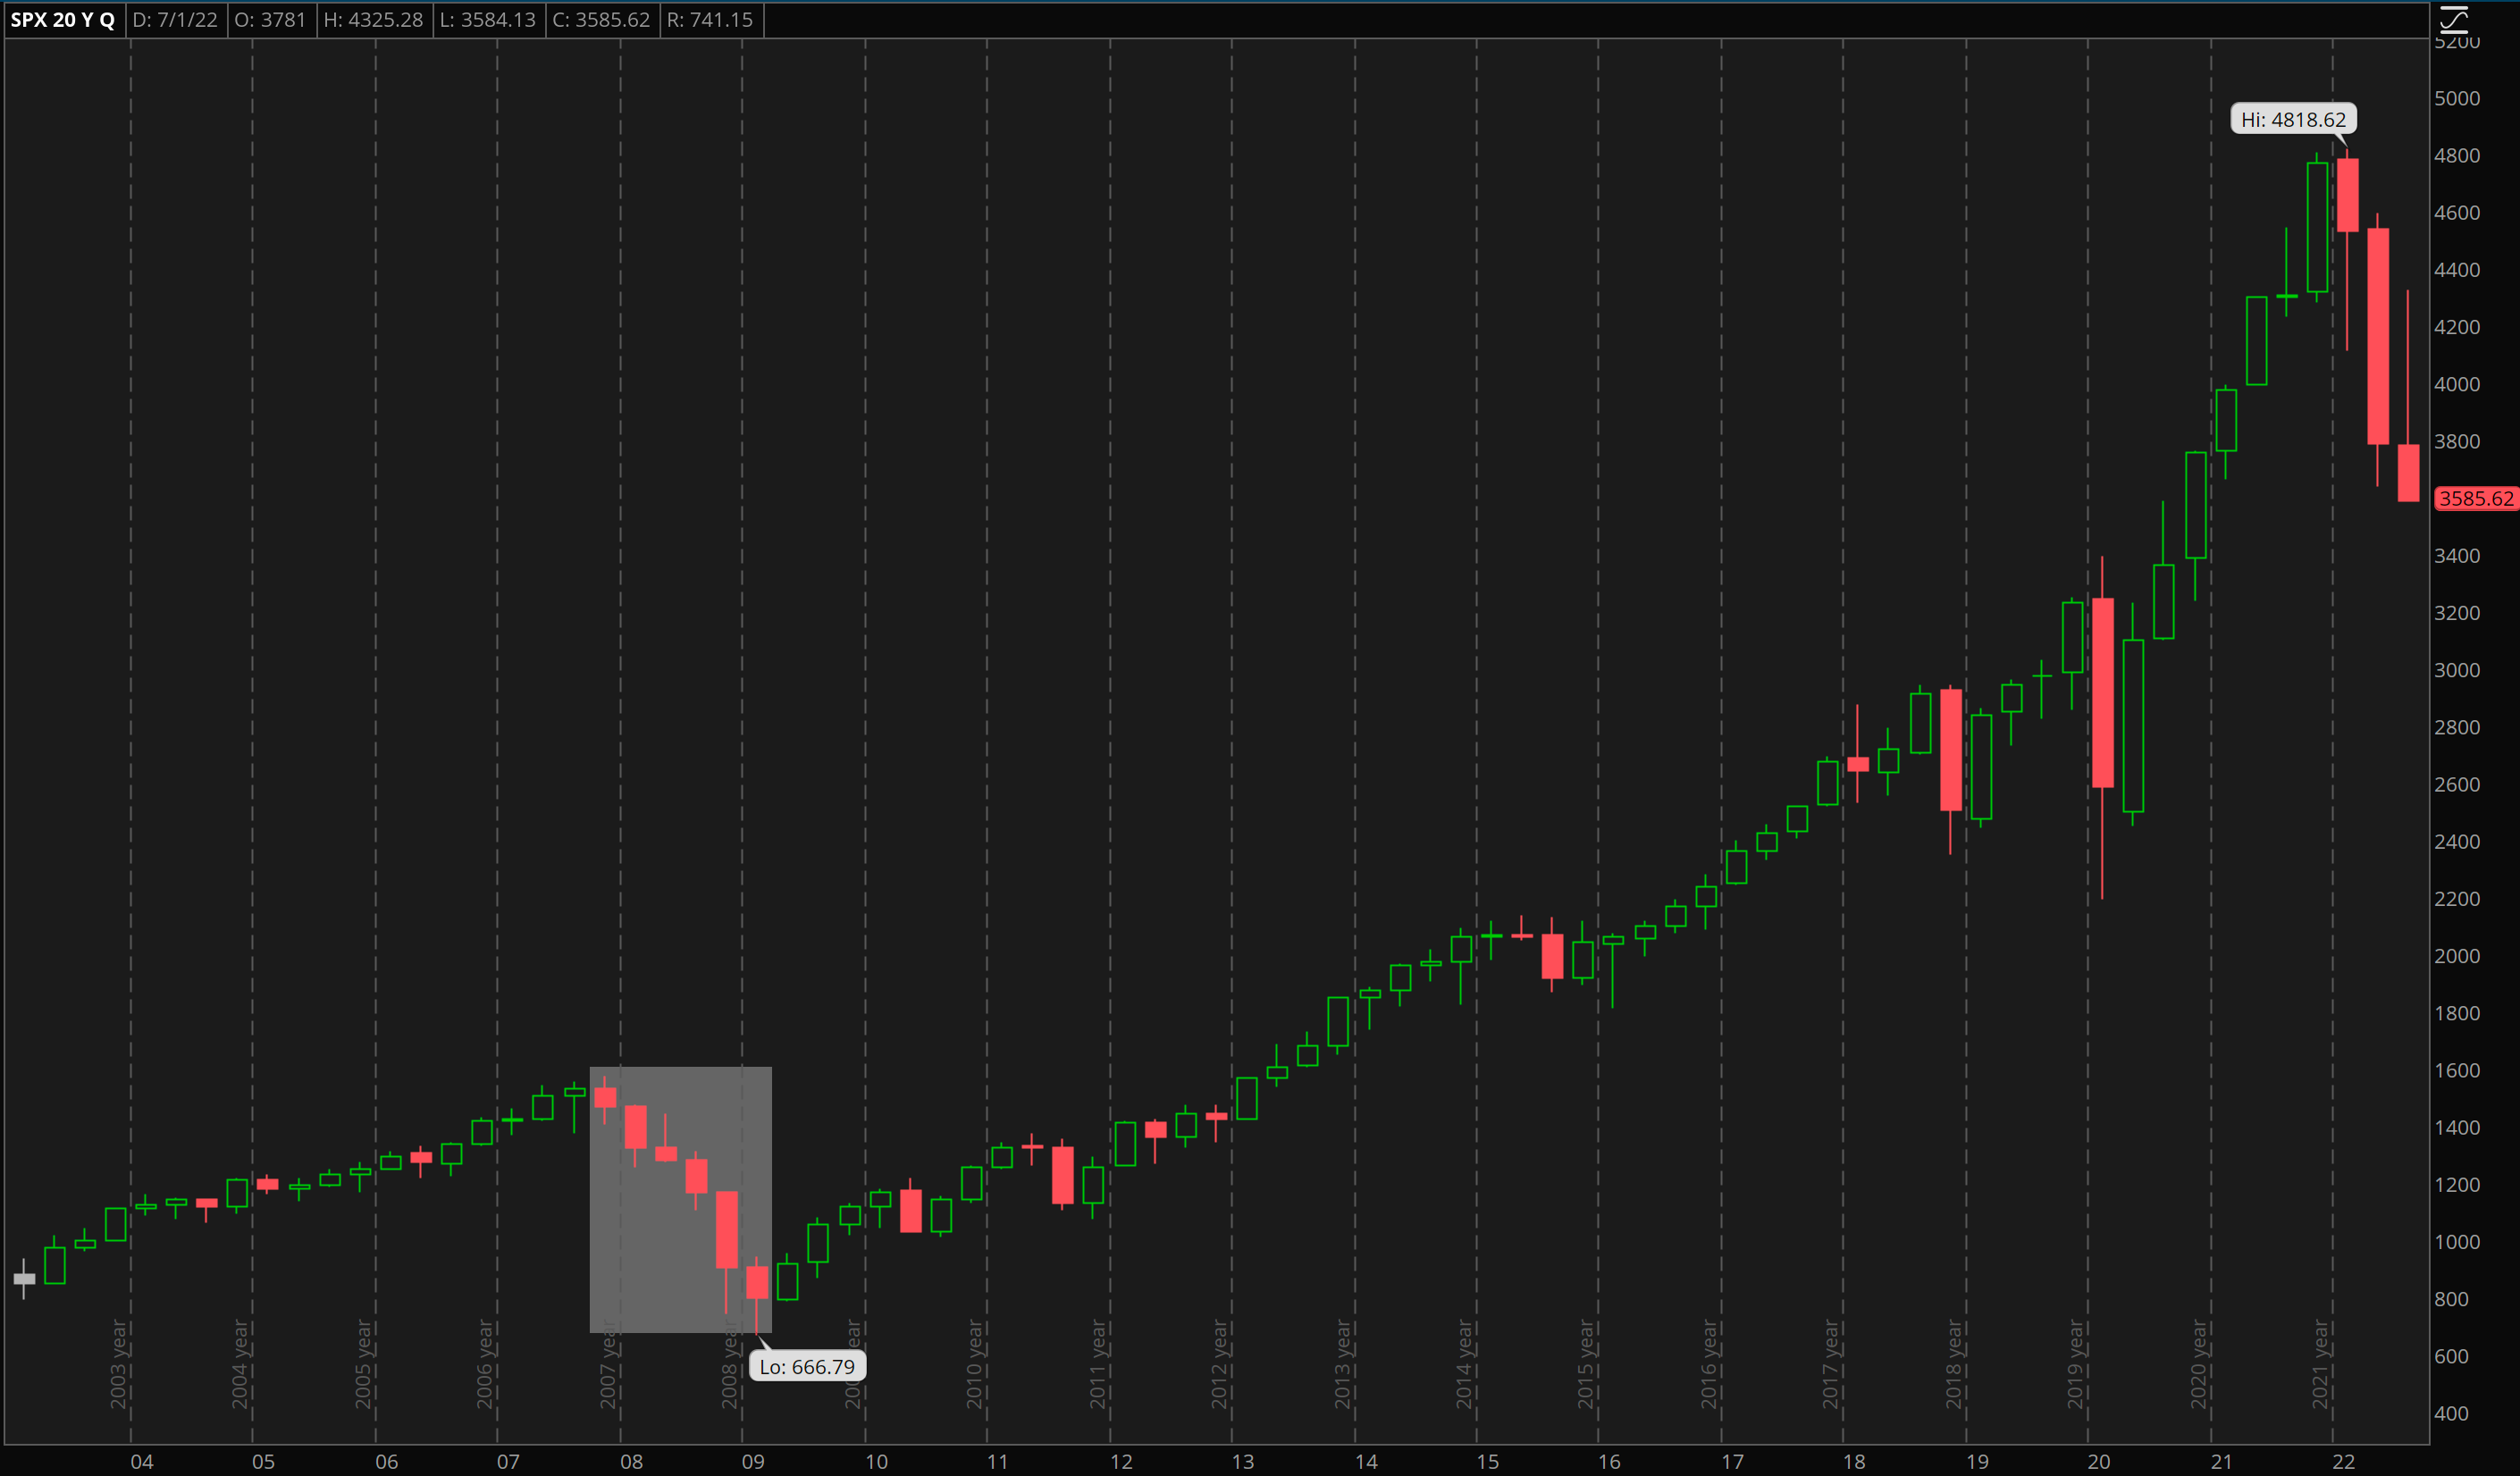
All three quarters in 2022 have been losses thus far. It’s the first time the index fell for three consecutive quarters since the run of six straight losing quarters ending in Q1 2009.
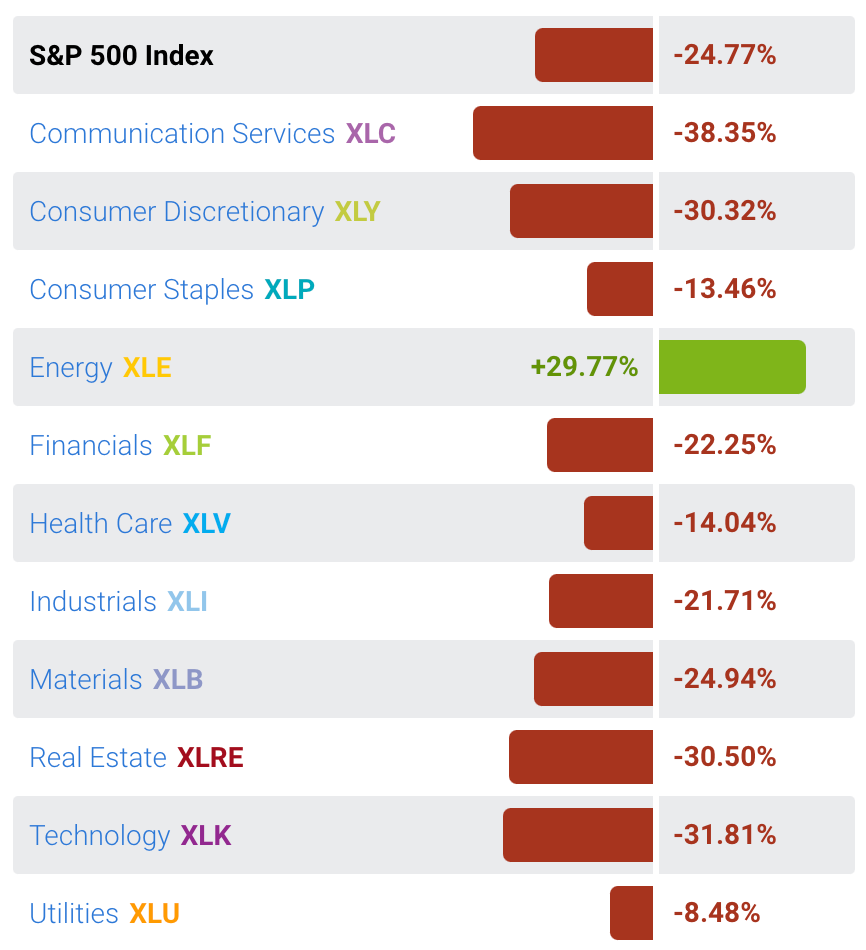
Drilling down, Energy is the only S&P sector that is up for the year.
As of Friday’s close, there were 171 tickers within 5% of their 52-week lows. Conversely, there were only 2 companies within 5% of their 52-week highs. Will the S&P catch a bid any time soon? In June, when the S&P 500 put new YTD lows in, it immediately rallied 10%. It’s now come down and erased the June low to trade underneath 3600 for the first time since November 2020. Below is a weekly chart going back 3-years. The red lines are some lows on a weekly timeframe that are of interest: 3511.91 and 3233.94. When the index sank to these levels, buyers took in the supply and pushed the market up. They haven’t been retested since.
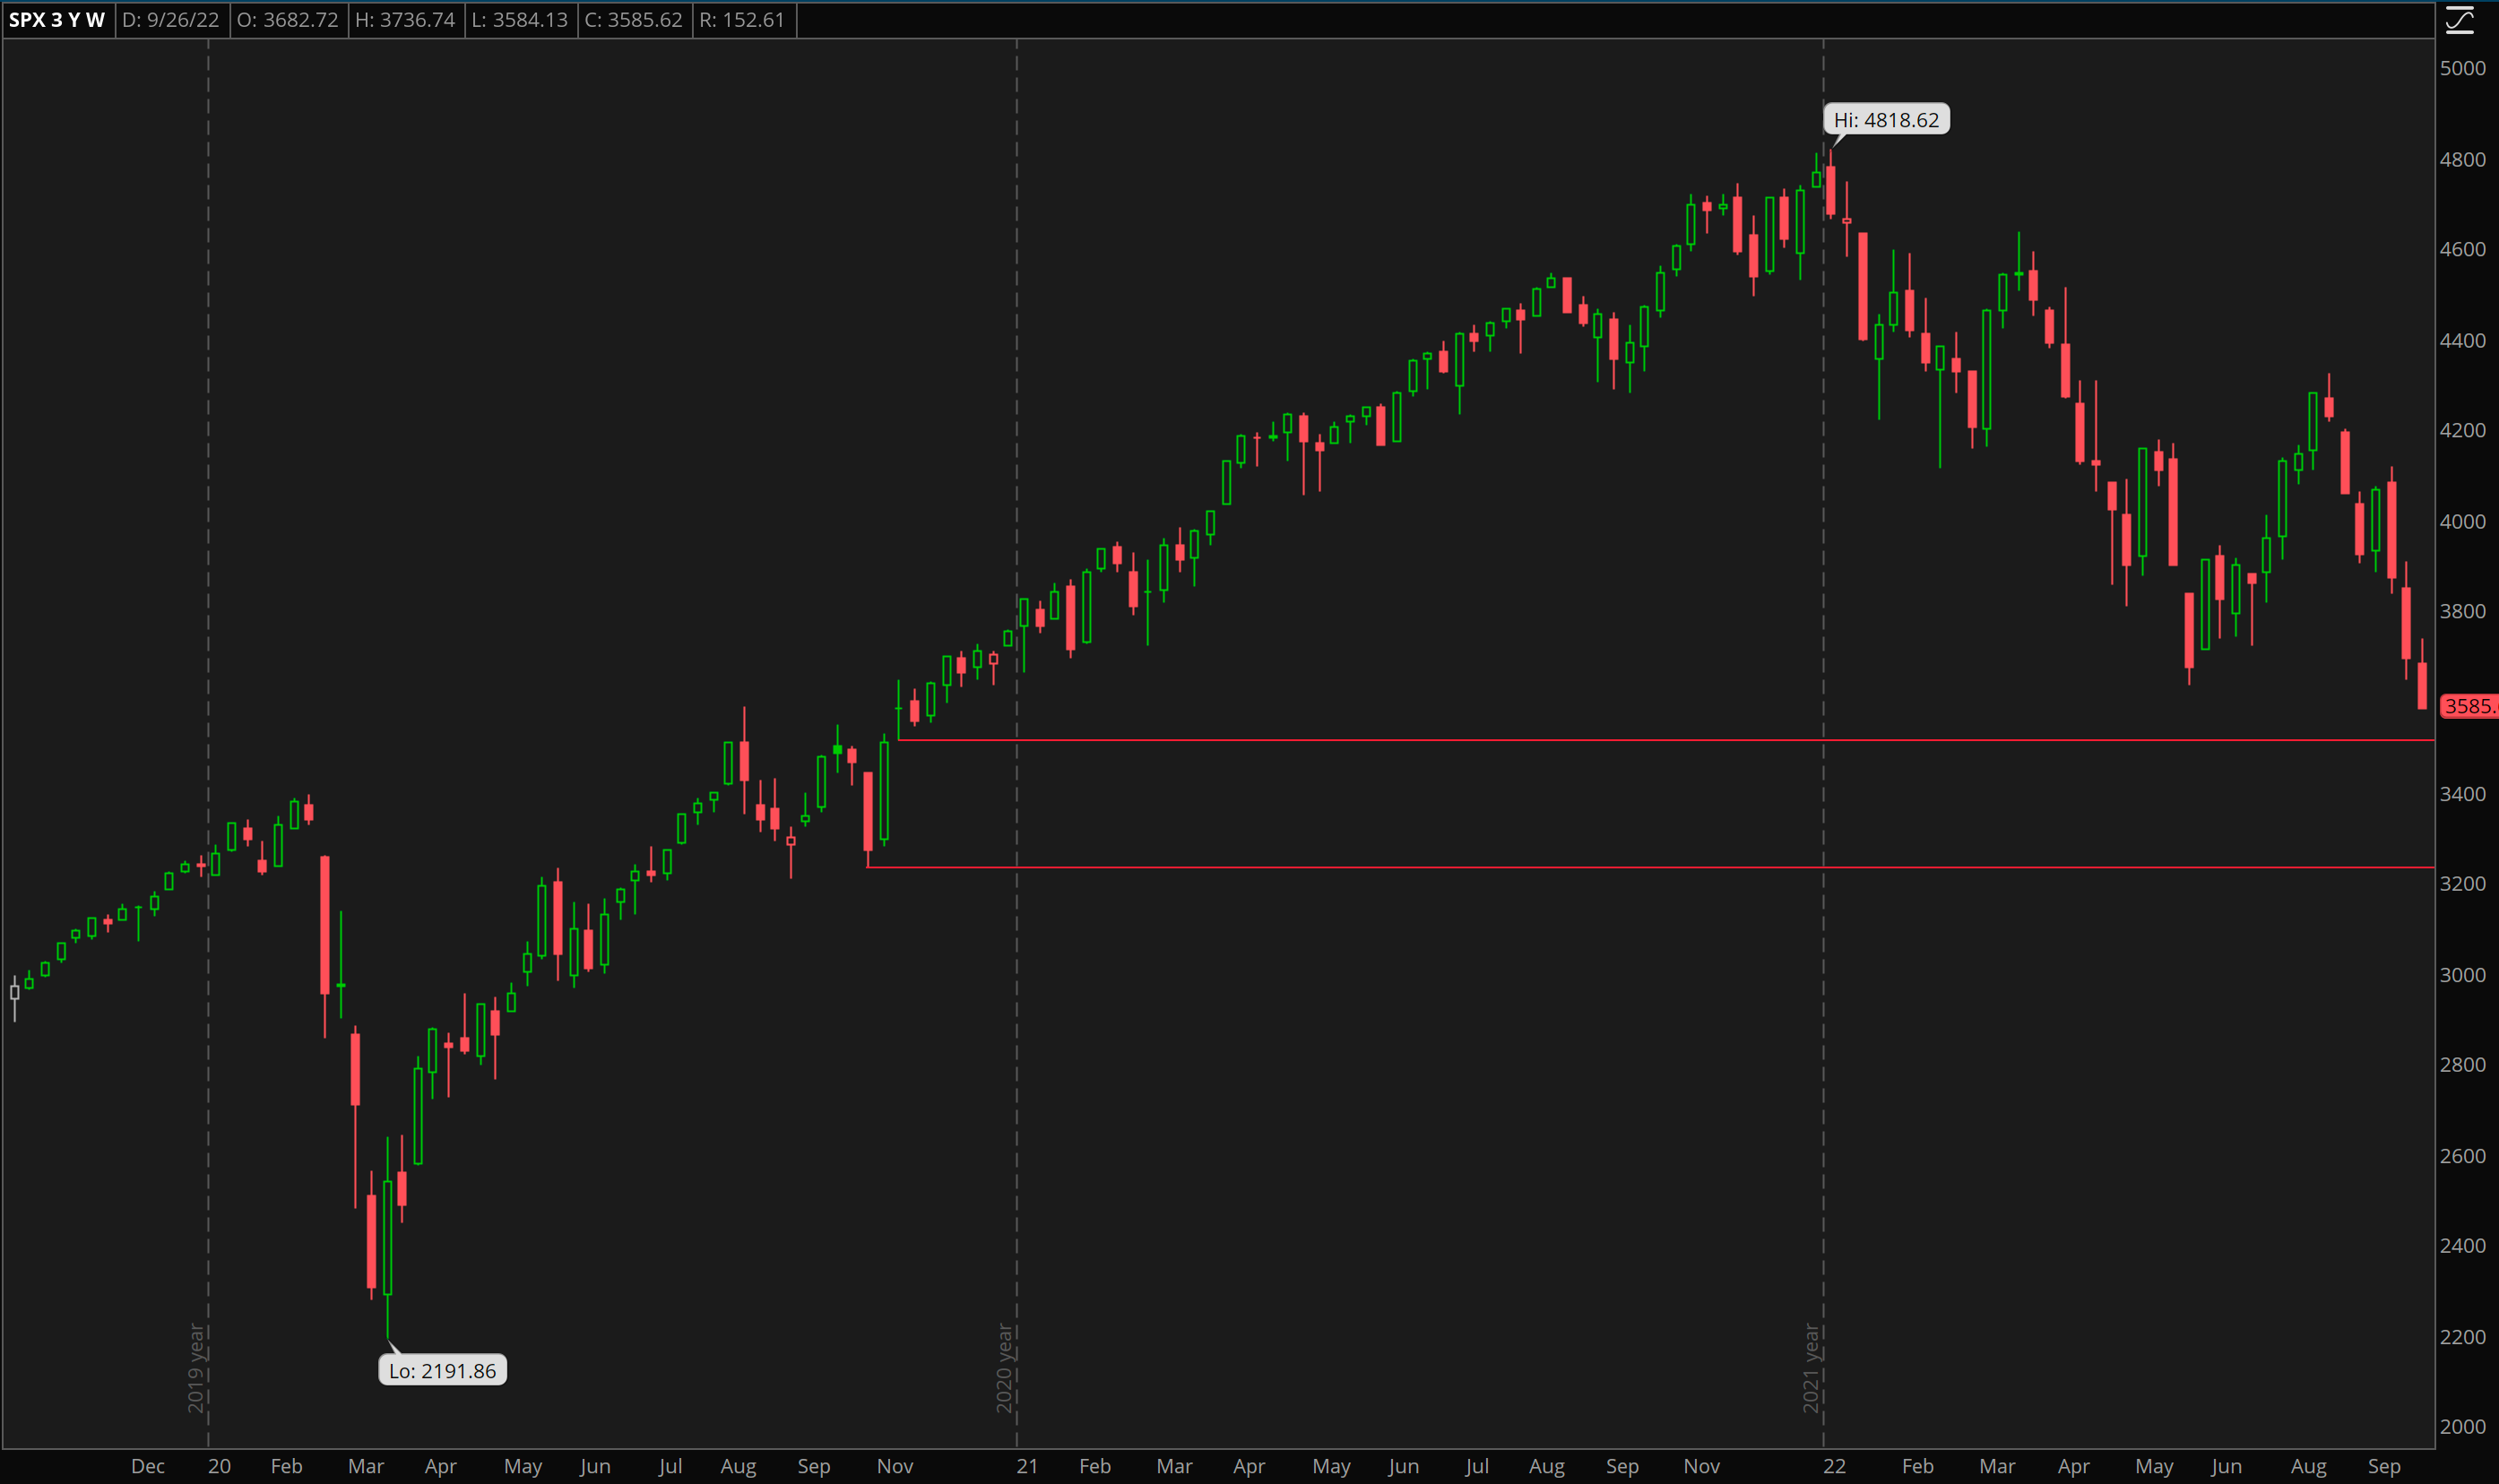
Looking at Fibonacci retracements, using the pandemic’s March 2020 intraday low and recent January 2022 intraday high, the S&P has broken down the 38.2 level. The 50% retracement level is 3505.24. The S&P needs to drop another 2.24% to hit this retracement. The 61.8 level is further down at 3195.28.

The average S&P 500 drawdown during a recession is 32%. The peak close for the S&P 500 happened on January 3rd and was 4796.56. A 32% drop from that point would put the S&P 500 at 3261.66. That’s another 9.03% drop from Friday’s close. The pre-pandemic closing high was 3386, reached in February 2020. It’s said that when the VIX peaks, the S&P prints a significant bottom. The VIX high in 2022 was back in January when it spiked to 38.94. The VIX high for Q3 was 34.88. For context, below are the VIX highs around the past four recession bottoms. It averaged 51.16. Whether we get a VIX spike and a clear bottom in this bear market remains to be seen.
