
Candles & Ticks | Daily Digest 09/19/2022
Markets rally late to finish green for the day

Market Overview

Markets staged a late comeback in the afternoon to erase the earlier losses. All four indices and 9 of 11 sectors finished green on the day. US Treasury yields inched higher as the 2-year approaches 4%. It’s currently at its highest level since 2007. All eyes will be on FOMC which will conclude on Wednesday and the Fed is expected to raise rates by another 0.75%.
Events this week:
Sept. 19: NAHB home builders' index
Sept. 20: Building permits (SAAR), Housing starts (SAAR)
Sept. 21: Existing home sales (SAAR), Federal Reserve statement, Fed Chair Jerome Powell news conference
Sept. 22: Initial jobless claims, Continuing jobless claims, Current account deficit (% of GDP), Leading economic indicators
Sept. 23: S&P U.S. manufacturing PMI (flash), S&P U.S. services PMI (flash)
Here are some of today’s closing prices.

Top-Down Analysis

Below are the monthly (5-years), weekly (2-years) and daily (6-months) charts for ES.

M/M: After rallying above the high of the previous 3-months, August lost 4% M/M. It closed below the midpoint from the prior 3-month range. ES has been balancing from May to August. Unless the month of September can eclipse the 4327.5 August high, ES will be OTFD.
W/W: ES had its worst week since mid-June. For the past 3-weeks ES has been in balance.
D/D: ES is in balance the past two sessions. 3834 and 3820.25 were the last unbroken lows in the 3800 range on the daily chart.
Performance & Metrics
Performance

Metrics

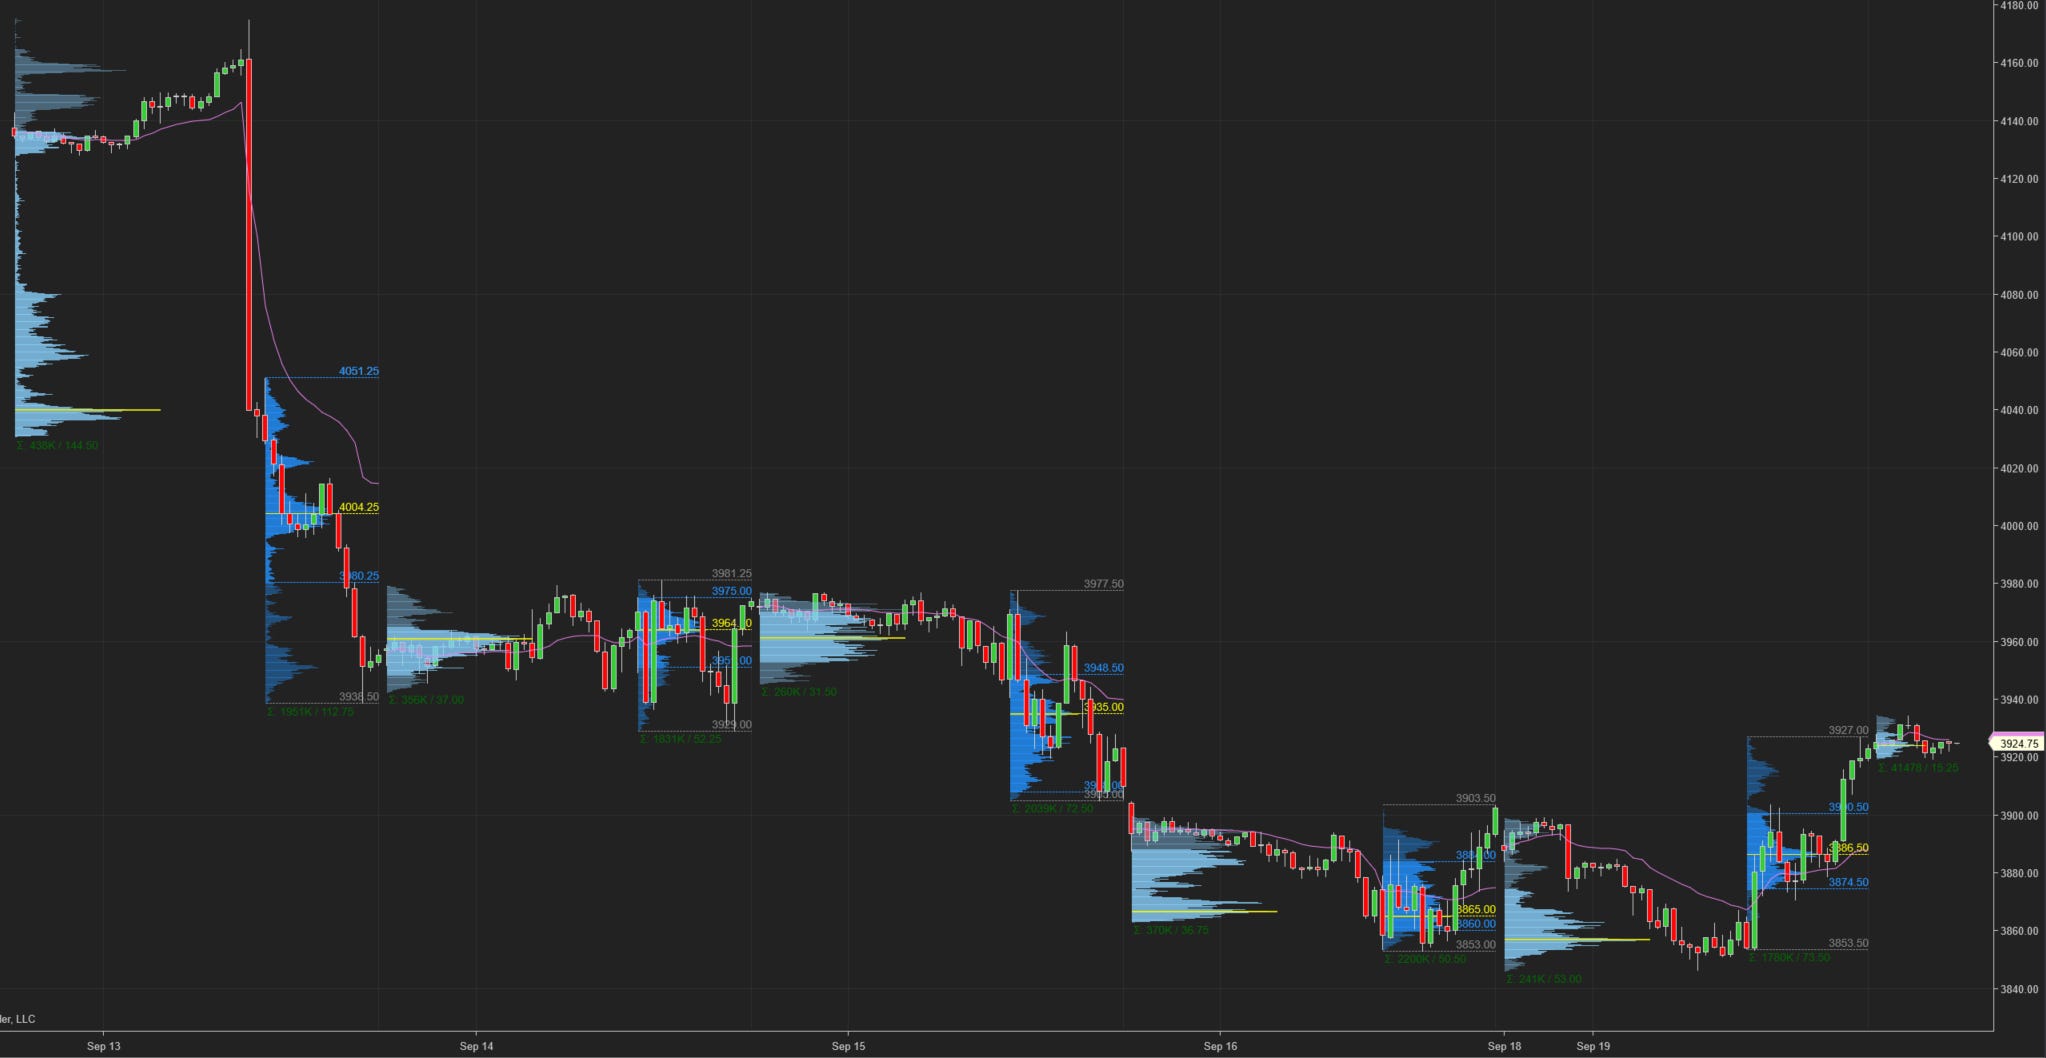
ES Composite Volume Profile (5 days)
ETH VAH: 3994.50
ETH VPOC: 3967.50
ETH VAL: 3876
Here is a chart of the past five sessions with a composite ETH Volume Profile:

ES RTH Volume Profile (today)
RTH VAH: 3900.50
RTH VPOC: 3886.50
RTH VAL: 3874.50
Here is a chart of the past five sessions with a daily ETH/RTH split Volume Profile:
ES RTH Market Profile (today)
RTH TPOC: 3884.50
RTH Poor Low/High: n/a
RTH Single Prints: 3903.75 to 3906.75
RTH Excess: 3853.50 to 3870.50; 3924.50 to 3927
Here’s a TPO chart of today’s session with ETH/RTH split Market Profile:

Session Recap
Electronic Trading Hours (ETH)
Globex Session:
Wholesale was short at the prior day’s close. The ONO was slightly above the prior day’s VAH, but inside the HOD. Inventory during Globex was 100% short. There was overhead supply in Globex as ES couldn’t rise above the previous day’s RTH close or HOD. After several TPO periods when Japanese markets opened up, shorts pushed ES down and through the previous day’s value area. Several periods into the London session, ES dipped below the prior day’s LOD before getting back above. There was excess from 3846.25 to 3850.25.
ONO: 3889.5
ONH: 3899.25
ONL: 3846.25
Range: 53
Regular Trading Hours (RTH)
US Session:
The RTH open was inside the prior day’s price range by 1-point. It was below the prior day’s value area and T+2 low. There was little to no supply at the open as buyers lifted ES off the short-term ledge at 3853.5 (A-period and period ending right before RTH). Buyers lifted ES 50-points as the first three TPO periods were OTFU. At 3903.75, one tick above the prior day’s high, supply was met and ES fell 30-points. At 3870.5, supply ran out inside the prior day’s value area. ES rotated back and forth for the next few time periods before supply emptied and longs took advantage. The raised ES 50-points in 4 TPO periods and above the prior day’s HOD. ES ended RTH at 3922.75. ES hasn’t been able to end the RTH session below the 61.8% Fibonacci retracement level from the June low to August high.

O: 3854
H: 3927
L: 3853.50
Range: 73.50