
Candles & Ticks | Daily Digest 09/15/2022
Stocks slip again as the S&P 500 nears the well-contested 3900 level

Market Overview

After opening with some positive momentum, stocks couldn’t hold on and markets fell again. All four major indices along with 9/11 sectors were in the red. The 2-year yield reached 3.877%, a level it hasn’t touched since November 2007. The table above shows the S&P’s 3-day performance following a day with a drawdown of 3% or greater in 2022. In the previous occurrences, on average day 3 provided some relief. In typical “buy the rumor, sell the news” fashion, Ether fell more than 10% following a successful “Merge.”
Here are some of today’s closing prices.

Top-Down Analysis

Below are the monthly (5-years), weekly (2-years) and daily (6-months) charts for ES.

M/M: After rallying above the high of the previous 3-months, August lost 4% M/M. It closed below the midpoint from the prior 3-month range. ES has been balancing from May to August. Unless the month of September can eclipse the 4327.5 August high, ES will be OTFD.
W/W: ES has broken the streak of three straight negative weeks and OTFD. ES is in balance heading into next week’s quadruple witching and CPI print.
D/D: ES has made lower highs and lower lows the past 3-sessions and is OTFD. 3900 remains a critical level as ES hasn’t had settlement below it since July 18th.
Performance & Metrics
Performance

Metrics

ES Composite Volume Profile (5 days)
ETH VAH: 4049.50
ETH VPOC: 3967.50
ETH VAL: 3905
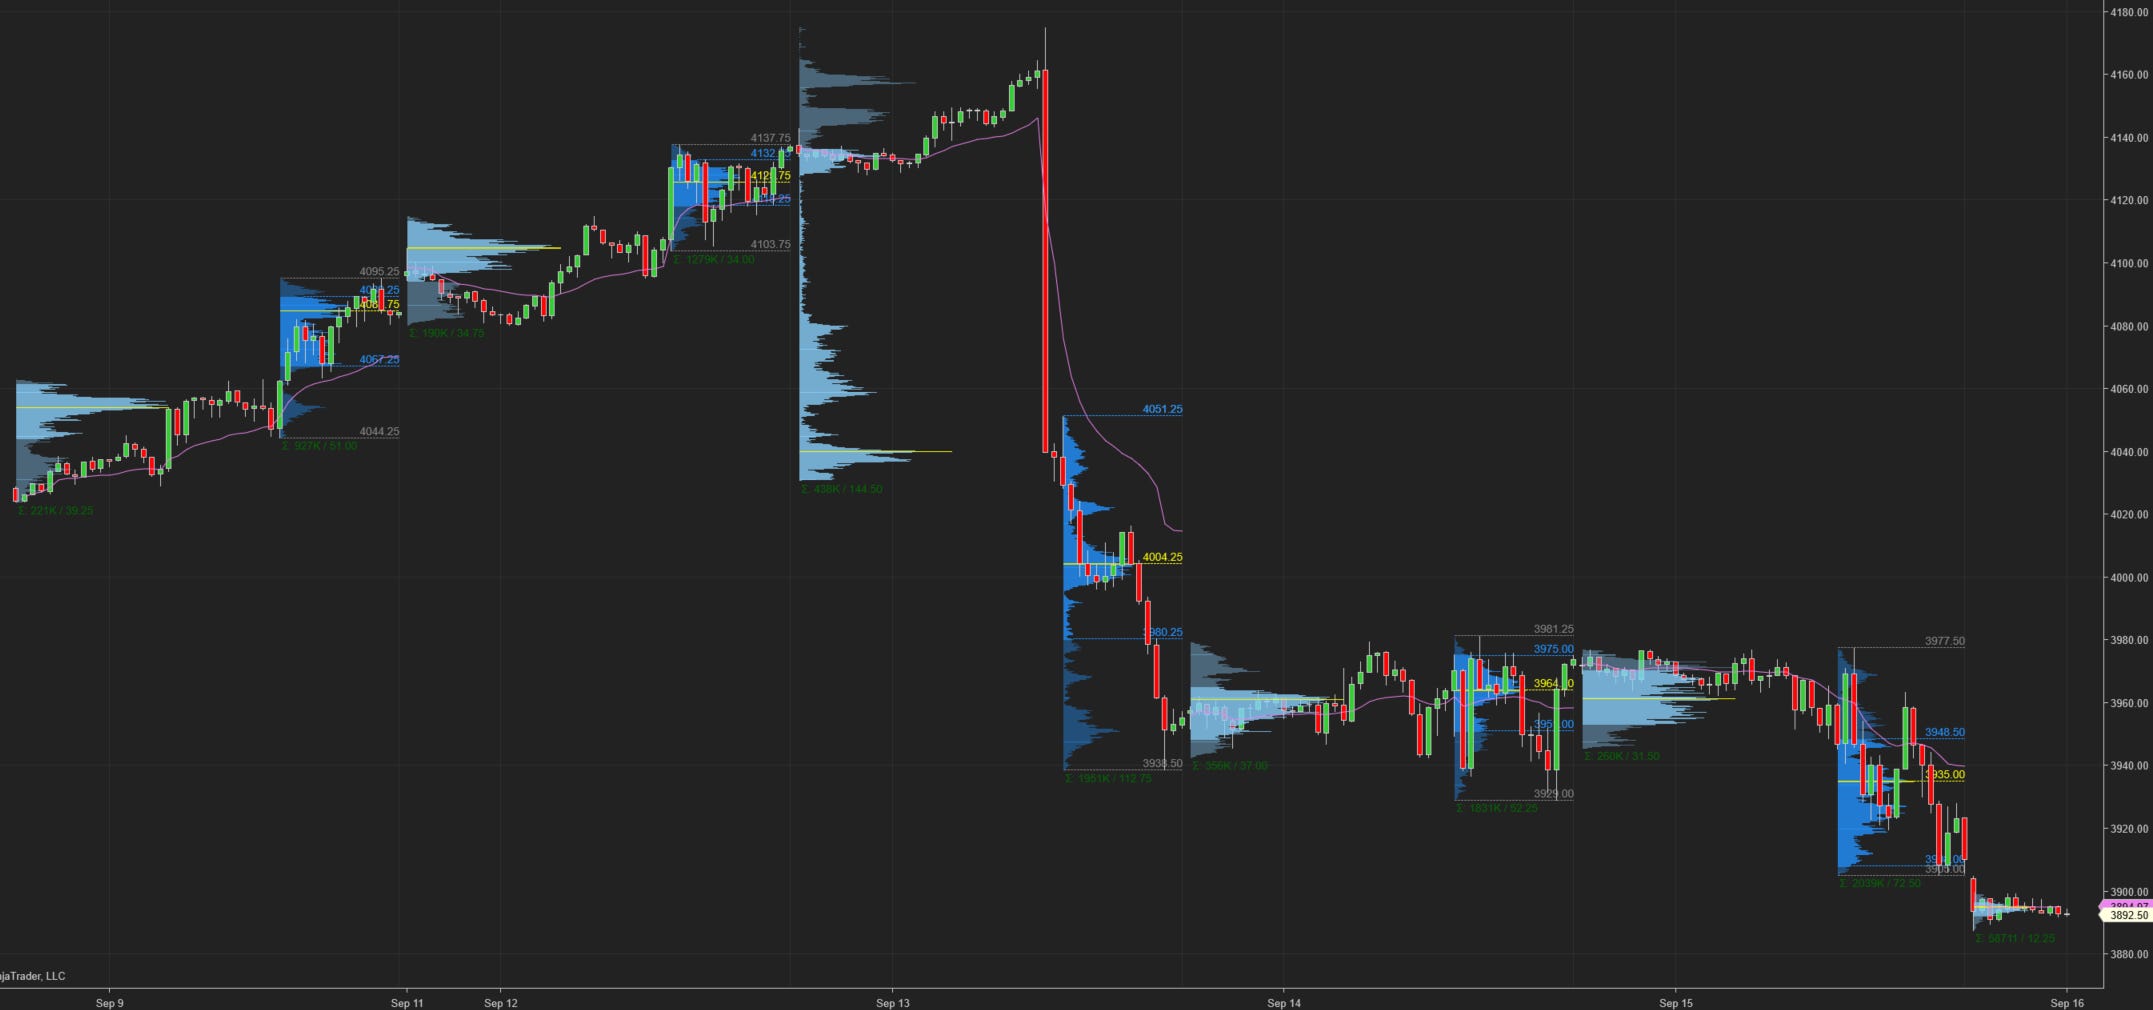
Here is a chart of the past five sessions with a composite ETH Volume Profile:
ES RTH Volume Profile (today)
RTH VAH: 3948.50
RTH VPOC: 3935
RTH VAL: 3908
Here is a chart of the past five sessions with a daily ETH/RTH split Volume Profile:
ES RTH Market Profile (today)
RTH TPOC: 3942.5
RTH Poor Low/High: n/a
RTH Single Prints: n/a
RTH Excess: 3905 to 3905.5; 3971.25 to 3977.5
Here’s a TPO chart of today’s session with ETH/RTH split Market Profile:

Session Recap
Electronic Trading Hours (ETH)
Globex Session:
Wholesale was long at the prior day’s close. The ONO was a couple of points inside the prior day’s VAH. Globex inventory was primarily short, 87% of the time. There was a poor high / triple top at 3977, indicating strong supply of trapped longs. The prior day’s VAH was only exceeded by 2-points. In the other direction, ES stayed above the previous day’s VAL for most of the session. In the moments leading up to RTH, shorts gained momentum and were able to take the auction below the VAL.
ONO: 3972
ONH: 3977
ONL: 3945.50
Range: 31.50
Regular Trading Hours (RTH)
US Session:
The RTH open was below the prior day’s value area but inside the LOD. It was also inside the T+2 low. After the opening bell, the selling from Globex continued as it erased the ONL. AT 3940.5, supply ran out as the prior day’s LOD was left in tact. ES rotated upwards and rallied nearly 40-points. The Globex triple top was removed by several ticks before supply was met and wouldn’t budge. Buyers disappeared as supply pushed ES down 50-points over the next few TPO periods. The prior session low, previous day’s LOD and T+2 low were all surpassed to the downside. At 3919.5, supply faded as shorts covered. This led to a 40-point pop as ES got back into the prior day’s value area. This did not last as supply at 3963.5, near the ON VPOC, weighed down heavily on the market. ES dropped nearly 60-points, managing to stay just above the 3900 level before short covering ensued. RTH closed at 3910.
O: 3947
H: 3977.5
L: 3905
Range: 72.5