Candles & Ticks | Daily Digest 09/08/2022
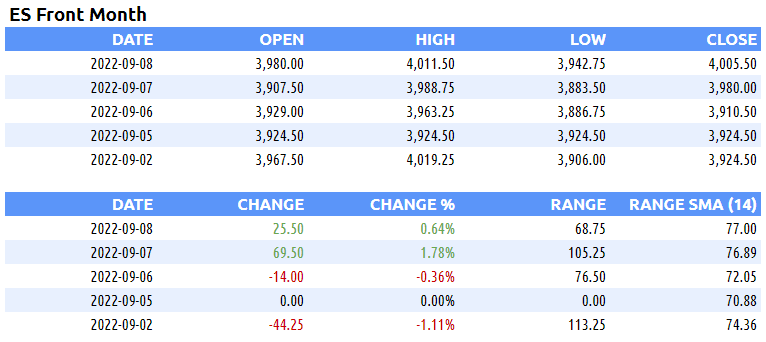
Markets rose for a 2nd straight day despite numerous comments from the Fed regarding interest rates and inflation
Market Overview
Markets rallied for a second straight day despite Fed Chair Powell reiterating the Central Bank’s goal to decrease inflation. All 4 indices and 8/11 sectors were green. Consumer staples, communications and utilities all fell. Treasury yields rebounded. Bitcoin and Ether also were green. Ether continues to outperform ahead of next week’s Merge.
Here are some of today’s closing prices.
Top-Down Analysis
Below are the monthly (5-years), weekly (2-years) and daily (6-months) charts for ES.
M/M: After rallying above the high of the previous 3-months, August lost 4% M/M. It closed below the midpoint from the prior 3-month range. ES has been balancing from May to August. Unless the month of September can eclipse the 4327.5 August high, ES will be OTFD.
W/W: ES has had three straight negative weeks and has been OTFD. By closing underneath 3950, ES is inside the 5-week balance zone from mid-June to July on the weekly timeframe.
D/D: Two straight days of rallies for ES. Sellers tried to move the market down but there wasn’t enough supply to erase the prior day’s low. ES is beginning to OTFU.
Unbroken Levels (M, W, D)
Highs: 4631, 4588.75, 4519.75, 4509, 4393.25, 4327.50, 4315, 4295.50, 4288, 4221.50, 4217.25, 4072.75, 4019.25, 4011.5,
3988.75Lows: 3942.75, 3883.5, 3834, 3820.25, 3780.25, 3723.75, 3693.25, 3661.5, 3639, 3596, 3592.25, 3575.25, 3545.5, 3518, 3506.5
Performance & Metrics
Performance
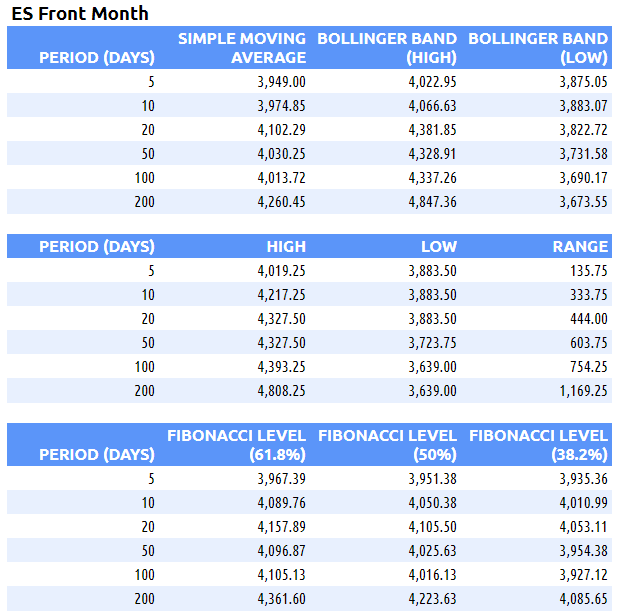
Metrics
ES Composite Volume Profile (5 days)
ETH VAH: 3980.50
ETH VPOC: 3930
ETH VAL: 3894
Here is a chart of the past five sessions with a composite ETH Volume Profile:
ES RTH Volume Profile (today)
RTH VAH: 4009
RTH VPOC: 3993
RTH VAL: 3972.50
Here is a chart of the past five sessions with a daily ETH/RTH split Volume Profile:
ES RTH Market Profile (today)
RTH TPOC: 3984.75
RTH Poor Low/High: n/a
RTH Single Prints: n/a
RTH Excess: 3942.75 to 3952.5 ; 4011 to 4011.50
Here’s a TPO chart of today’s session with ETH/RTH split Market Profile:
Session Recap
Electronic Trading Hours (ETH)
Globex Session:
Wholesale was long at the prior day’s close. The ONO was inside the prior day’s value area and right at VPOC. Inventory during Globex was mostly balanced. It was slightly long around 72% of the time. It eclipsed the prior day’s double top by about 7-points. As it approached RTH, ES began a hard correction and selloff to erase the prior session lows. This was a 43.5-point decline off the ONH which filled the prior day’s single prints. There was supply above 3996. The ON session left two sets of single prints.
ONO: 3980
ONH: 3996
ONL: 3952.5
Range: 43.5
Regular Trading Hours (RTH)
US Session:
The RTH open was inside the previous day’s value area and above the T+2 high. At the open, shorts tried to push ES lower. The ONL was erased but the auction couldn’t get below the prior day’s value area. Supply ran out at 3942.75 and ES rotated higher. The prior day’s HOD and ONH were both eclipsed. At 4010.75, supply was met and ES started to fall as demand also faded. The auction lost 60-points to get back into the prior day’s value area before supply dried up again. Buyers came and lifted the offer and again ES rose above the previous day’s high and ONH. After balancing and trading in a range for several TPO periods, buyers kept coming and the offer was lifted. The prior session high was passed and ES closed above 4000.
O: 3955.25
H: 4011.50
L: 3942.75
Range: 68.75


