
Candles & Ticks | Daily Digest 09/06/2022

Market Overview

Markets started the short week in a slump again. All 4 indices fell and 4/11 sectors were green, led by real estate. The chart above is a 10-year monthly chart of the 10-year yield with a 10-month EMA. The 10-year currently sits just below the November 2018 high and has a chance to close above it for the first time this month. Bitcoin and Ether both fell with $BTC losing the $19k level.
Events this week:
Sept. 7: Cleveland Fed President Mester, Fed Vice Chair Brainard and Fed Vice Chair for Bank Supervision Barr all speak
Sept. 8: Fed Chair Powell and Chicago Fed President Evans both will speak
Sept. 9: Chicago Fed President Evans (again) and Kansas City Fed President George speak
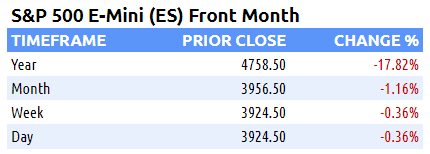
Here are some of today’s closing prices.

Top-Down Analysis
Below are the monthly (5-years), weekly (2-years) and daily (6-months) charts for ES.

M/M: After rallying above the high of the previous 3-months, August lost 4% M/M. It closed below the midpoint from the prior 3-month range. ES has been balancing from May to August. Unless the month of September can eclipse the 4327.5 August high, ES will be OTFD.
W/W: ES has had three straight negative weeks and has been OTFD. By closing underneath 3950, ES is inside the 5-week balance zone from mid-June to July on the weekly timeframe.
D/D: That’s two straight sessions with lower highs, lows and closing prices as ES begins to OTFD. It’s now right at the former resistance level where mid-July rally began.
Unbroken Levels (M, W, D)
Highs: 4631, 4588.75, 4519.75, 4509, 4393.25, 4327.50, 4315, 4295.50, 4288, 4221.50, 4217.25, 4072.75, 4019.25, 3963.25
Lows:
3906,3903.5, 3886.75, 3834, 3820.25, 3780.25, 3723.75, 3693.25, 3661.5, 3639, 3596, 3592.25, 3575.25, 3545.5, 3518, 3506.5
Performance & Metrics
Performance

Metrics

ES Composite Volume Profile (5 days)
ETH VAH: 3977
ETH VPOC: 3930
ETH VAL: 3902
Here is a chart of the past five sessions with a composite ETH Volume Profile:

ES RTH Volume Profile (today)
RTH VAH: 3923
RTH VPOC: 3909
RTH VAL: 3893.50
Here is a chart of the past five sessions with a daily ETH/RTH split Volume Profile:

ES RTH Market Profile (today)
RTH TPOC: 3909
RTH Poor Low/High: n/a
RTH Single Prints: n/a
RTH Excess: 3886.75 to 3893.75; 3943.25 to 3944.50
Here’s a TPO chart of today’s session with ETH/RTH split Market Profile:

Session Recap
Electronic Trading Hours (ETH)
Globex Session:
Wholesale was short at the prior day’s close. The ONO from Sunday evening was inside of the prior day’s value area, just below VPOC. Inventory during that Globex session was balanced in a 27-point range. The abbreviated RTH session open was a couple of points below the prior day’s close. Inventory during the RTH session was long. ES traded in a 12-point range during RTH, all of which was inside the Globex period. Both Globex and the abbreviated RTH session’s price action were inside of Friday’s value area. Last night’s ONO was also inside of Friday’s value area. Inventory during Globex was mostly long before correcting just before RTH. The single prints from Friday’s selloff were filled. ES only dipped below Friday’s RTH close briefly in the first and final TPO periods.
ONO: 3929
ONH: 3963.25
ONL: 3915.25
Range: 48
Regular Trading Hours (RTH)
US Session:
The RTH open was inside of Friday’s value area and above the T+2 low. During the NYSE opening hour, there was no demand. ES sold off and erased the low from the extended Globex session, as well as the LOD from Friday’s RTH. At 3886.75, supply ran out. Short covering then stabilized the selloff and caused a near 60-point reversal. Once the buying and covering eased up, ES fell and traded sideways in a 20 to 30-point range underneath 3920. ES closed RTH at 3908.25
O: 3934
H: 3944.50
L: 3886.75
Range: 57.75