
Candles & Ticks | Daily Digest 09/02/2022
Early September gains erased as S&P slides for 3rd straight week
Market Overview

Stocks rose as the nonfarm payroll and employment data came in near expected. There were 315k jobs added in August and 3.7% unemployment, highest since Feb. Stocks were up but around noon that all came crumbling down. 3/4 indices ended the day down more than 1%, while only 1/11 sectors finished in the green (energy). The 10-year also lost 1%. Bitcoin and Ether were down also.

Here are some of today’s closing prices.

Top-Down Analysis

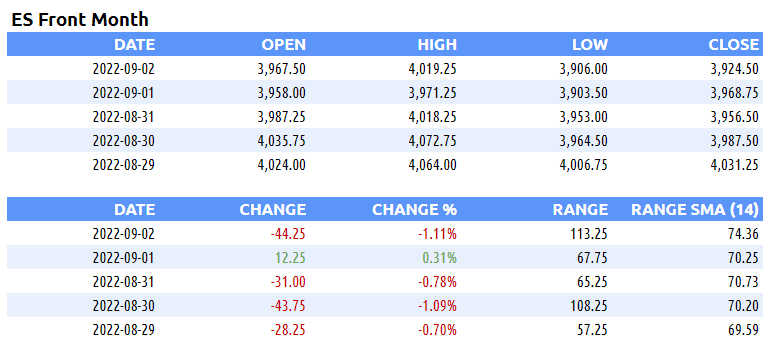
Below are the monthly (5-years), weekly (2-years) and daily (6-months) charts for ES.

M/M: After rallying above the high of the previous 3-months, August lost 4% M/M. It closed below the midpoint from the prior 3-month range. ES has been balancing from May to August. Unless the month of September can eclipse the 4327.5 August high, ES will be OTFD.
W/W: ES has had three straight negative weeks and has been OTFD. By closing underneath 3950, ES is inside the 5-week balance zone from mid-June to July on the weekly timeframe.
D/D: After taking out the highs from the prior two sessions, ES erased all the gains and closed at the lowest level since July 26th. The low from the late July balance zone was 3913.25. ES traded below this in each of the past two sessions but supply ran out each time. A close below 3913 could mean that the bid holding this zone has faded and the lower levels (3834) could be in play.
Unbroken Levels (M, W, D)
Highs: 4631, 4588.75, 4519.75, 4509, 4393.25, 4327.50, 4315, 4295.50, 4288, 4221.50, 4217.25, 4072.75, 4019.25,
4018.25,3971.25Lows: 3906, 3903.5, 3834, 3820.25, 3780.25, 3723.75, 3693.25, 3661.5, 3639, 3596, 3592.25, 3575.25, 3545.5, 3518, 3506.5
Performance & Metrics
Performance
Metrics

ES Composite Volume Profile (5 days)
ETH VAH: 4016.50
ETH VPOC: 3986.50
ETH VAL: 3923.50
Here is a chart of the past five sessions with a composite ETH Volume Profile:

ES RTH Volume Profile (today)
RTH VAH: 3991
RTH VPOC: 3930
RTH VAL: 3906
Here is a chart of the past five sessions with a daily ETH/RTH split Volume Profile:

ES RTH Market Profile (today)
RTH TPOC: 3931.75
RTH Poor Low/High: n/a
RTH Single Prints: 3947.25 to 3961.25; 3968.75 to 3973.25
RTH Excess: 3906 to 3923.25; 4017.5 to 4019.25
Here’s a TPO chart of today’s session with ETH/RTH split Market Profile:

Session Recap
Electronic Trading Hours (ETH)
Globex Session:
Wholesale was long at the prior day’s close. The ONO was almost 4-points inside the prior day’s RTH HOD. Inventory during Globex was balanced in a narrow 20-point range. Price action was rotational in this channel and never got beyond 8-points above the prior day’s close, erasing its HOD by only a couple of points. To the downside, ES couldn’t get anywhere near the prior day’s VAH. Traders were waiting for the nonfarm payroll figures and once they were released, ES reacted positively. It jumped 30-points, hitting new session highs and two standard deviations above VWAP. At 4002, short of the HOD from two days ago and the 50-day SMA, demand fell off and ES corrected down. Supply failed to get down to VWAP and ES rotated back up towards the 1st and 2nd standard deviations and new ON session highs. Globex had a double distribution with 2.5-points of excess below 3957.75. There was a set of single prints from about 3975.75 to 3991.5.
ONO: 3967.50
ONH: 4009.25
ONL: 3955.25
Range: 54
Regular Trading Hours (RTH)
US Session:
The RTH open gapped up and was above the prior day’s HOD, but in between the T+2 high and low. There were no buyers at the open so ES sold down and nearly filled the ON set of single prints. A responsive bid was met near VWAP so the auction traded back and forth around VWAP and the plus/minus 1 standard deviations. Supply eventually pushed ES lower and filled the ON single prints. Sellers couldn’t get down into the prior day’s price range and at 3973.25, supply ran out and longs / short covering lifted ES back to the positive side of VWAP. ES climbed higher and longs took out the ONH and T+2 high by 9-ticks. Demand eventually faded and supply crashed on the bid. Over three TPO periods ES fell 82-points, getting beneath the T+2 low. Shorts covered near the prior day’s VPOC and ES stabilized in this vicinity for several TPO periods. When the covering ended, ES fell and nearly took out the prior day’s low but supply ran out 1.5-points in front. Shorts covered and stabilized the auction through the remainder of RTH.
O: 4006.5
H: 4019.25
L: 3906
Range: 113.25