
Candles & Ticks | Daily Digest 09/01/2022
Stocks mixed ahead of key jobs report tomorrow
Market Overview

The markets were mixed as the Dow and S&P recovered their early losses and closed on the plus side. 8/11 sectors were up on the day. The semiconductor ETF, $SMH, gapped down and lost 2% on the day after it was revealed the US government is restricting Nvidia's sales of its AI chips to China and Russia. Treasuries gained again led by the 10-year which was up 4%.
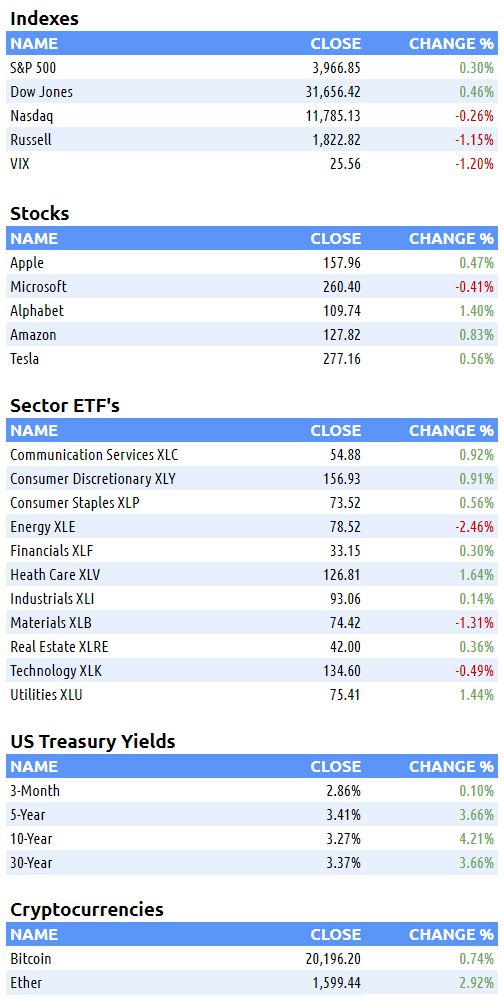
Here are some of today’s closing prices
Top-Down Analysis

Below are the monthly (5-years), weekly (2-years) and daily (6-months) charts for ES.

M/M: After rallying above the high of the previous 3-months, August lost 4% M/M. It closed below the midpoint from the prior 3-month range. ES has been balancing from May to August. Unless the month of September can eclipse the 4327.5 August high, ES will be OTFD.
W/W: ES is OTFD and is on the verge of ending with three consecutive losing weeks.
D/D: ES dipped below the floor of the late July balance zone. However, supply fizzled and buyers sent the auction into positive territory on the day. ES has been OTFD for three straight days.
Unbroken Levels (M, W, D)
Highs: 4631, 4588.75, 4519.75, 4509, 4393.25, 4327.50, 4315, 4295.50, 4288, 4221.50, 4217.25, 4072.75, 4018.25, 3971.25
Lows:
3953,3938.75,3913.25, 3903.5, 3834, 3820.25, 3780.25, 3723.75, 3693.25, 3661.5, 3639, 3596, 3592.25, 3575.25, 3545.5, 3518, 3506.5
Performance & Metrics
Performance

Metrics

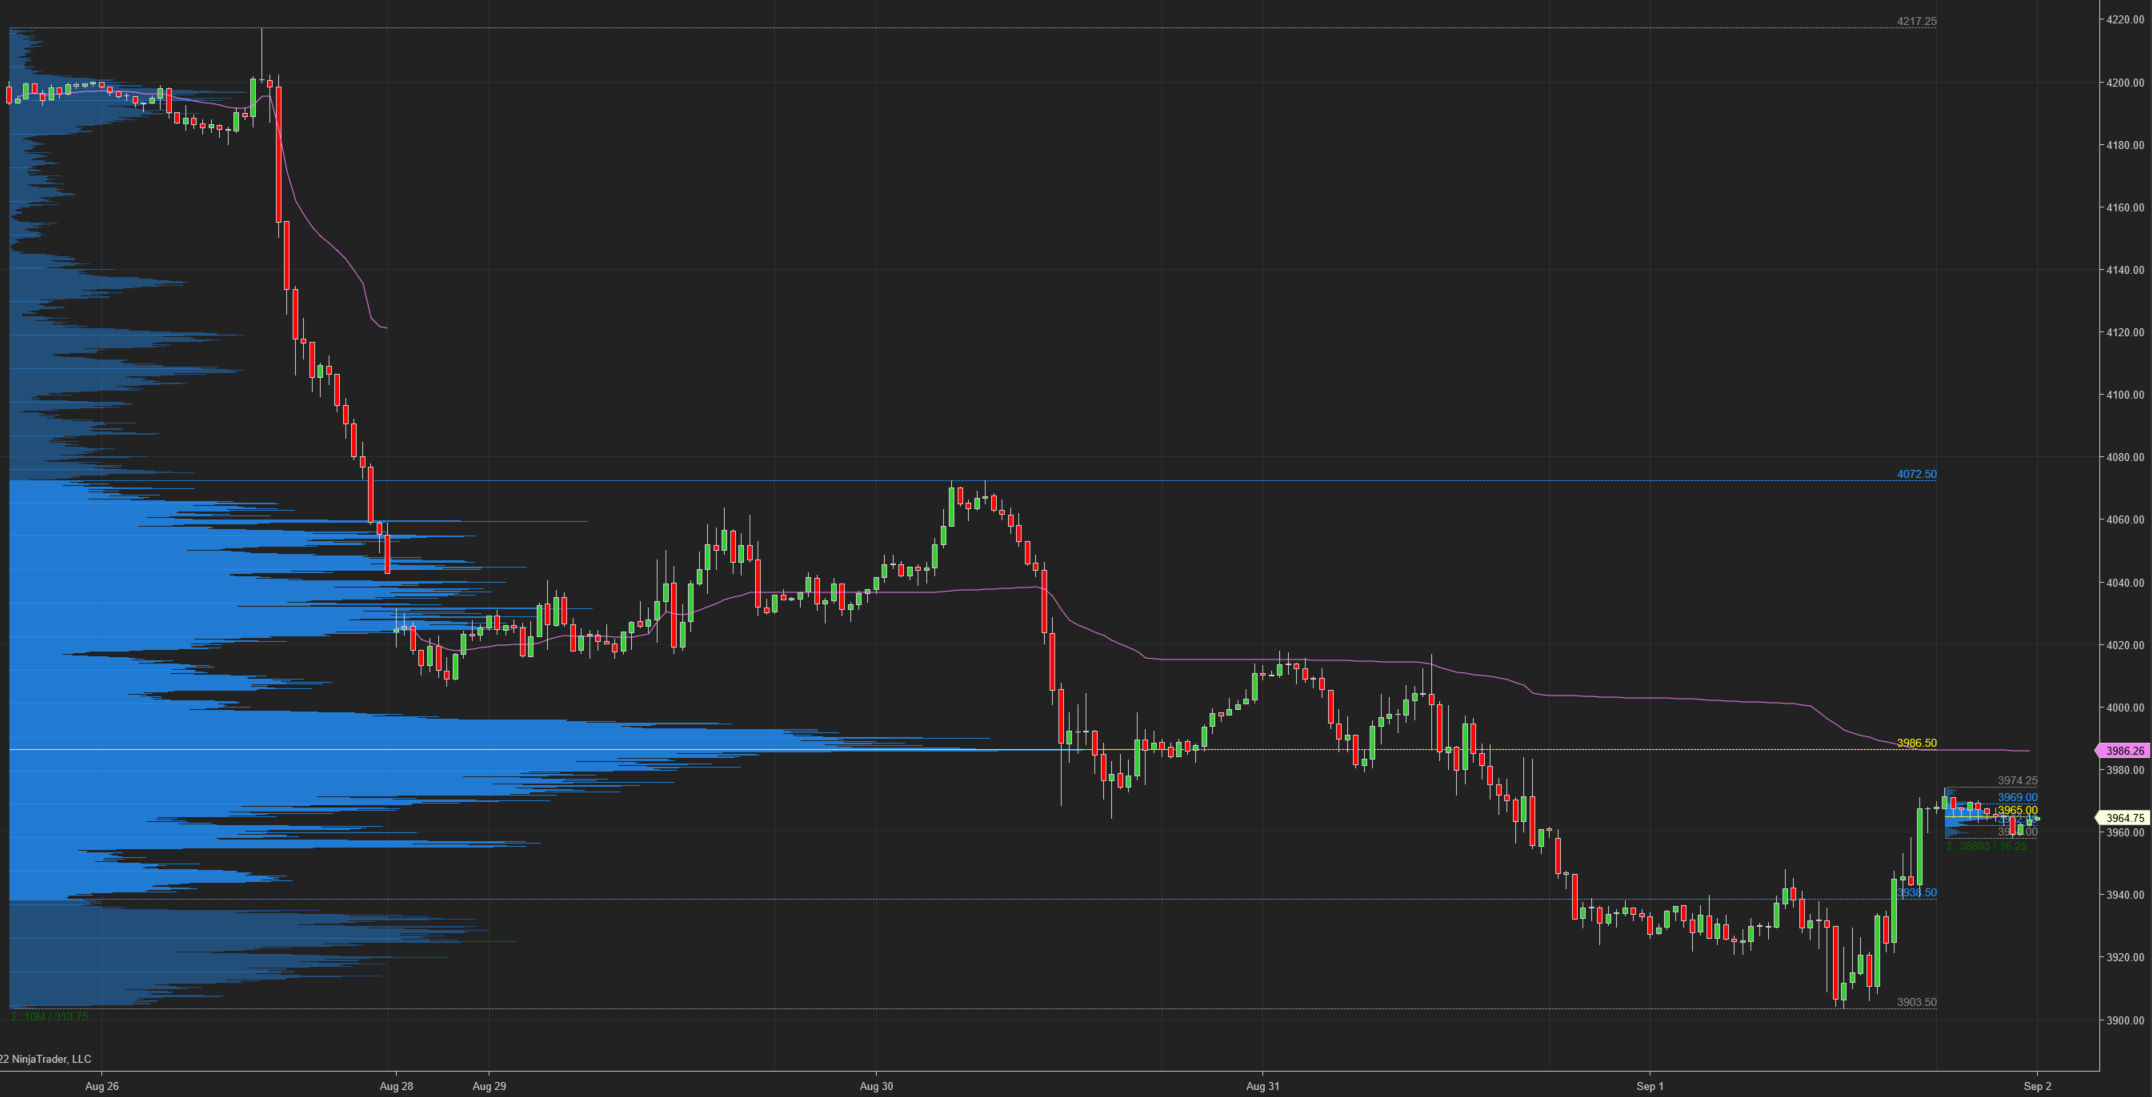
ES Composite Volume Profile (5 days)
ETH VAH: 4072.50
ETH VPOC: 3986.50
ETH VAL: 3938.50
Here is a chart of the past five sessions with a composite ETH Volume Profile:
ES RTH Volume Profile (today)
RTH VAH: 3940.5
RTH VPOC: 3925
RTH VAL: 3904.50
Here is a chart of the past five sessions with a daily ETH/RTH split Volume Profile:

ES RTH Market Profile (today)
RTH TPOC: 3923.25
RTH Poor Low/High: n/a
RTH Single Prints: n/a
RTH Excess: 3-ticks of excess below 3904.25 and and 5-ticks above 3970
Here’s a TPO chart of today’s session with ETH/RTH split Market Profile:

Session Recap
Electronic Trading Hours (ETH)
Globex Session:
Wholesale was short at the prior day’s close. The ONO was inside the prior day’s value area, slightly above VPOC. Inventory during Globex was basically 100% short after only trading above the prior day’s close by 2-ticks. The auction dropped below the previous day’s LOD and remained there for the entire ON session. A double bottom / poor low was put in at 3921, erasing the LOD from July 20th. The LOD from July 26th (3913.25) still held up. ES traded sideways below VWAP for most of the ON session. Later in Globex, ES rose above VWAP momentarily but the buying couldn’t lift the offer above 3948.25, leaving excess above towards the ONH.
ONO: 3958
ONH: 3961
ONL: 3921
Range: 40
Regular Trading Hours (RTH)
US Session:
The RTH open gapped down by 21-points and was below the T+2 low. After the opening bell, there was some chop as the auction whipped back and forth in a 15-point range. ES was unable to rise to the last swing high from Globex. Supply consumed the bid and eventually erased the ONL / poor low and July 26th LOD. It traded lower by about 5-points before short covering entered the picture. After a 20-point rally, the covering ended and ES fell again to new sessions lows at 3903.5. Supply ran out here and ES slowly climbed for the next few hours to get inside the prior session’s value area and T+2 low.
O: 3932
H: 3971.25
L: 3903.5
Range: 67.75