ES[U22] Debrief 08/29/2022
Market Overview
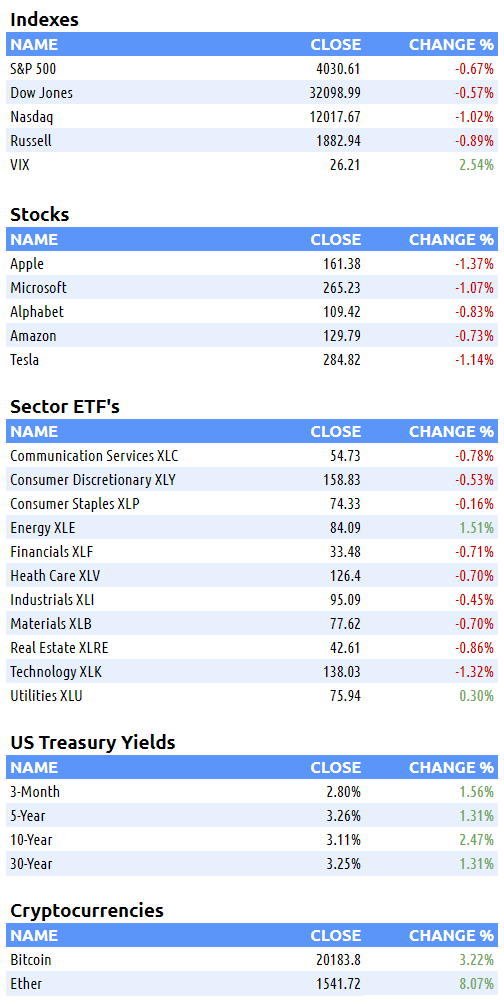
The selling cooled off from last Friday, but stocks still had a rough day nonetheless. 4/4 indices fell to begin the week and only 2/11 sectors were positive. Treasury yields continue to rise.
Events this week:
Aug. 30: Richmond and NY Fed Presidents speak, S&P Case-Shiller US home price index, Consumer confidence index and JOLTS
Aug. 31: Cleveland Fed President speaks, ADP employment report, Chicago manufacturing PMI
Sept. 1: Initial jobless claims, Continuing jobless claims, Productivity and Unit labor costs revision, S&P US manufacturing PMI, Atlanta Fed President speaks
Sept. 2: Nonfarm payrolls, Unemployment rate
Here are some of today’s closing prices.
Top-Down Analysis
Below are the monthly (5-years), weekly (2-years) and daily (6-months) charts for ES.
M/M: August has erased July’s high, thus ending OTFD at five months. The last four months have been trading sideways in a range from 3639 to 4327.50.
W/W: ES has now suffered a second straight week of losses and ended the weekly streak of OTFU.
D/D: The session opened with a gap down that was filled. There wasn’t enough supply to take out the 4000 level and challenge the 3994.50 (low from July 28). There wasn’t enough buying for ES to stay inside the prior day’s range either.
Unbroken Levels (M, W, D)
Highs: 4631, 4588.75, 4519.75, 4509, 4393.25, 4327.50, 4315, 4295.50, 4288, 4221.50, 4217.25, 4064
Lows:
4042.75, 4006.75, 3994.50, 3938.75, 3913.25, 3834, 3820.25, 3780.25, 3723.75, 3693.25, 3661.5, 3639, 3596, 3592.25, 3575.25, 3545.5, 3518, 3506.5
Performance & Metrics
Performance
Metrics
ES Composite Volume Profile (5 days)
ETH VAH: 4215
ETH VPOC: 4138.50
ETH VAL: 4089
Here is a chart of the past five sessions with a composite ETH Volume Profile:
ES RTH Volume Profile (today)
RTH VAH: 4049.50
RTH VPOC: 4031.50
RTH VAL: 4025
Here is a chart of the past five sessions with a daily ETH/RTH split Volume Profile:
ES RTH Market Profile (today)
RTH TPOC: 4043.75
RTH Poor Low/High: none
RTH Single Prints: none
RTH Excess: Below 4018.25 and above 4061.75
Here’s a TPO chart of today’s session with ETH/RTH split Market Profile:
Session Recap
Electronic Trading Hours (ETH)
Globex Session:
Wholesale was short at the prior day’s close. The ONO gapped down and was below the prior day’s RTH LOD. Inventory during Globex was 100% short beneath the prior day’s RTH close. The auction rotated below, above and below again VWAP inside a 34-point range. It partially filled the ON gap, coming within 2-points of a complete fill. Long positions are trapped above with the new 5-day composite profile value area ranging from 4120 to 4202.50. The closest stop underneath was 3994.50.
ONO: 4024
ONH: 4040.75
ONL: 4006.75
Range: 34
Regular Trading Hours (RTH)
US Session:
The RTH open gapped down and was below the prior day’s close and T+2 low. The opening gap was filled within the first half hour of trading. There wasn’t sustained buying to creep into the prior day’s value area. Supply pushed the auction underneath VWAP and out of the prior day’s range. Supply fizzled and failed to get below the ONL, so the auction rotated back up. Once over VWAP, ES kept climbing back into the previous day’s range and momentarily got above its VPOC by several points. ES went back and forth in a 20-point range until sellers swarmed the bid in the final 30-minutes of NYSE trading hours. ES closed RTH underneath VWAP and the prior day’s RTH close.
O: 4028
H: 4064
L: 4017
Range: 47


