
ES[U22] 07/12/2022

Market Overview
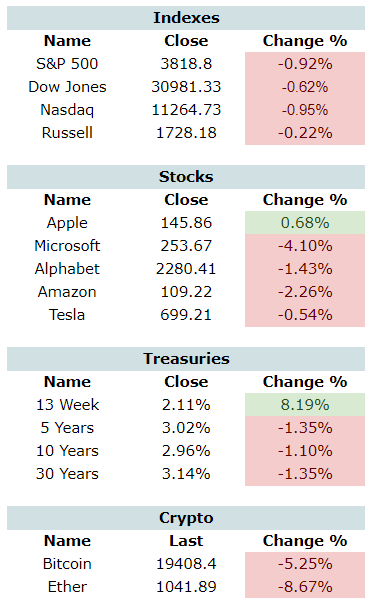
Risk assets fell again amid inflation and recession fears. 4/4 of the major equity indices and 11/11 S&P sectors fell ahead of tomorrow’s CPI number. Experts are expecting inflation to increase 8.8% YoY for a new 40-year high. Bitcoin and Ether each fell in excess of 5%. Most commodities fell as well headlined by crude’s 8% drop. The 2Y10Y curve remains inverted.

Here are some of today’s closing prices.
Top-Down Analysis
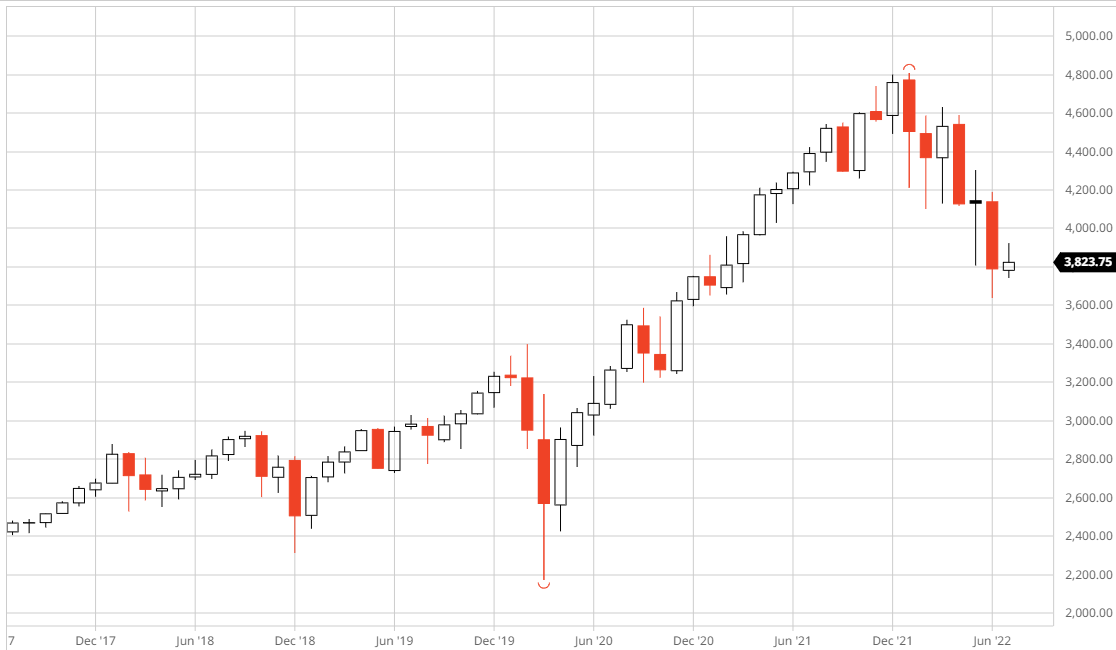
Monthly Change: +0.90%
ES has been OTFD for four consecutive months. If longs can’t erase the June high of 4189, then this trend will continue for a fifth straight month.
Prior month’s close: 3789.50
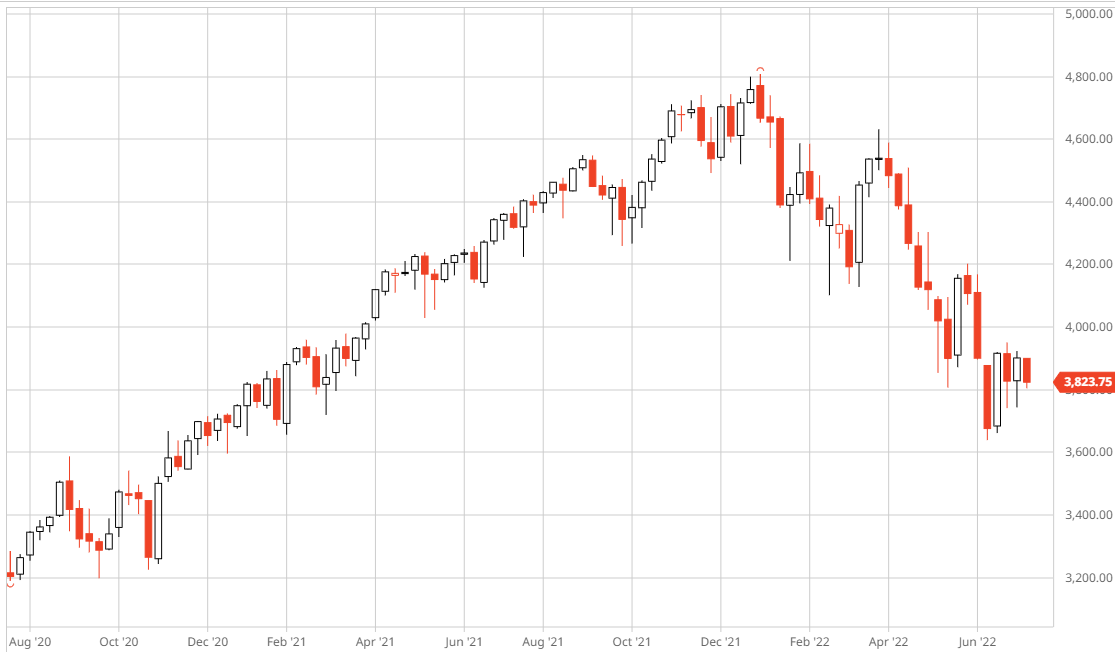
Weekly Change: -1.99%
Last week, there wasn’t enough supply to take out the previous week’s low of 3741.25. ES is now OTFU for four consecutive weeks. However, ES also couldn’t trade above 3950 as trapped longs’ offers held the market down. WoW it was an inside week last week.
Prior week’s close: 3901.25
Daily Change: -0.86%
After four consecutive up days, ES has now printed three straight down days. After failing to test 3950, ES is rotating down and OTFD.

Unbroken Levels (M, W, D)
Highs: 4631, 4588.75, 4519.75, 4509, 4393.25, 4303.5, 4303, 4202.25, 4189, 4168.25, 4160, 4144.25, 4030.5, 3950, 3922, 3900.75, 3876.5
Lows: 3804.75, 3744, 3741.25, 3735, 3693.25, 3661.5, 3639, 3596, 3592.25, 3575.25, 3545.5, 3518, 3506.5
Performance & Technicals

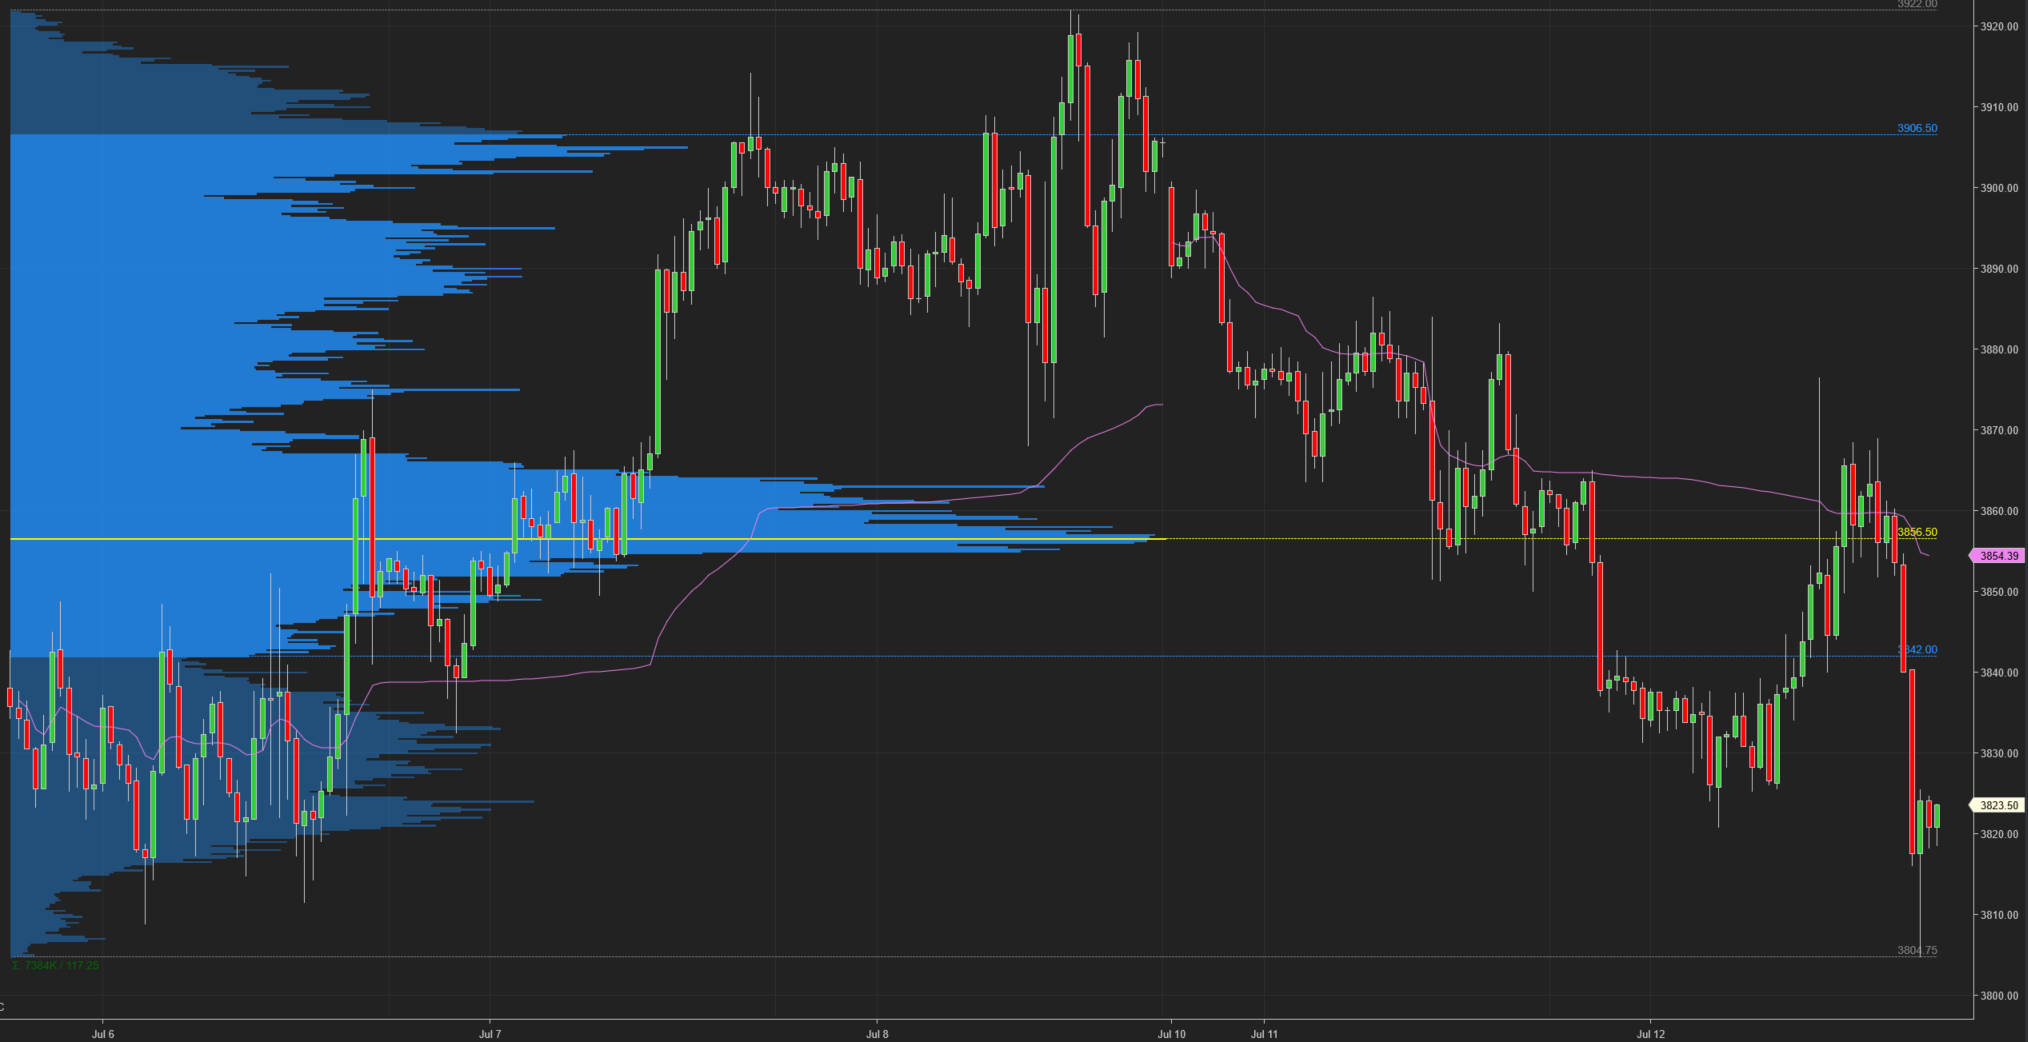
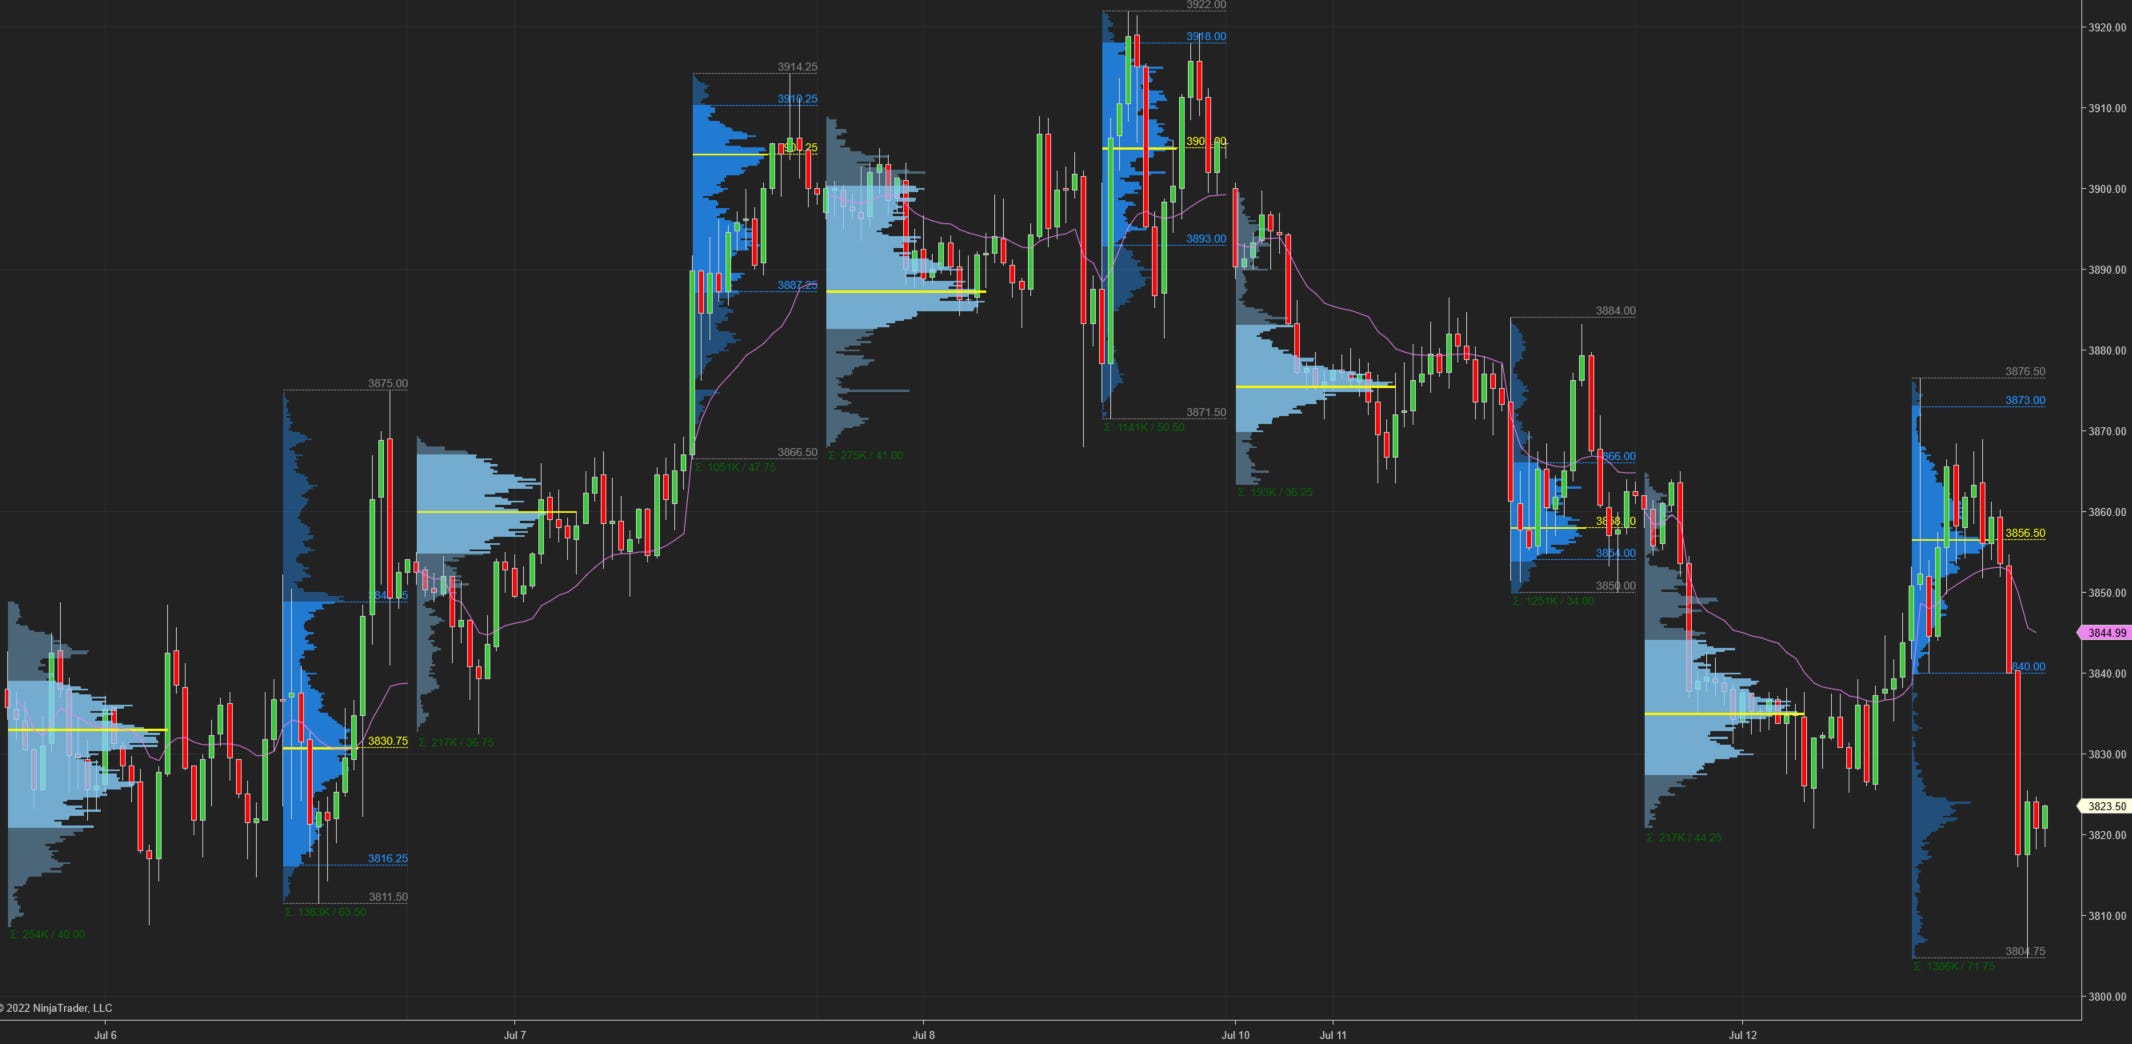
ES Composite Volume Profile (5 days)
ETH VAH: 3906.50
ETH VPOC: 3856.50
ETH VAL: 3842
ES RTH Volume Profile (today)
RTH VAH: 3873
RTH VPOC: 3856.50
RTH VAL: 3840
Prior Day RTH High and Low
T+2 High (for next RTH session): 3884
T+2 Low (for next RTH session): 3850
Here is a chart of the past five sessions with a composite ETH Volume Profile:
Here is a chart of the past five sessions with a daily ETH/RTH Volume Profile:
Here’s a TPO chart of today’s session with ETH/RTH Market Profile:
The TPOC is 3853.50. There were multiple sets of single prints:
above 3869.25 (trapped longs)
3825.5 to 3840 (trapped longs)
below 3815.75 (trapped shorts)
Session Recap
Electronic Trading Hours (ETH)
Globex Session:
Wholesale’s position at the previous day’s close was short. The ONO was inside of the previous day’s value area. Inventory during Globex was completely short and got beneath the previous day’s low. It began correcting long and got back into the previous day’s range just before RTH by a few ticks.
ONO: 3862
ONH: 3865
ONL: 3820.75
ONRange: 44.25
Regular Trading Hours (RTH)
US Session:
The RTH open was inside of the previous day’s price range by 1-point, but below the value area. It was below the T+2 low. After the opening bell, longs drove the auction up with minimal selling. They pushed through the previous day’s value area, erased the ONH and got into the T+2 range. There wasn’t enough buying to test the previous day’s high as supply was met around the 76.4% Fib level (measured high to low on previous day RTH). Supply sank ES beneath the T+2 low again, prior day’s value area and LOD. Once supply ran out at 3840, which turned out to be the VAL, ES rotated up into the previous day’s value area and above VWAP. ES distributed over VWAP for several time periods. There wasn’t enough demand to test the RTH HOD and once the buying ran out, shorts pushed ES lower in search of buyers. The RTH low from earlier at 3840 was erased as supply pushed ES lower, erasing the ONL. Shorts covered at 3804.75 to stabilize ES and it closed almost 20-points higher. The sharp move down left many traders trapped.
O: 3851
H: 3876.50
L: 3804.75
Range: 71.75