ESM22 Daily Debrief 04/29/2022
Market Overview
Equities got smoked last week. The S&P 500 was red every week in April. The FOMC statement is happening this Wednesday with expectations of a 0.25-0.50% rate hike. This is followed by NFP on Friday so equities might be in for another volatile week of trading.
Here are some of Friday’s closing prices.
Top-Down Analysis
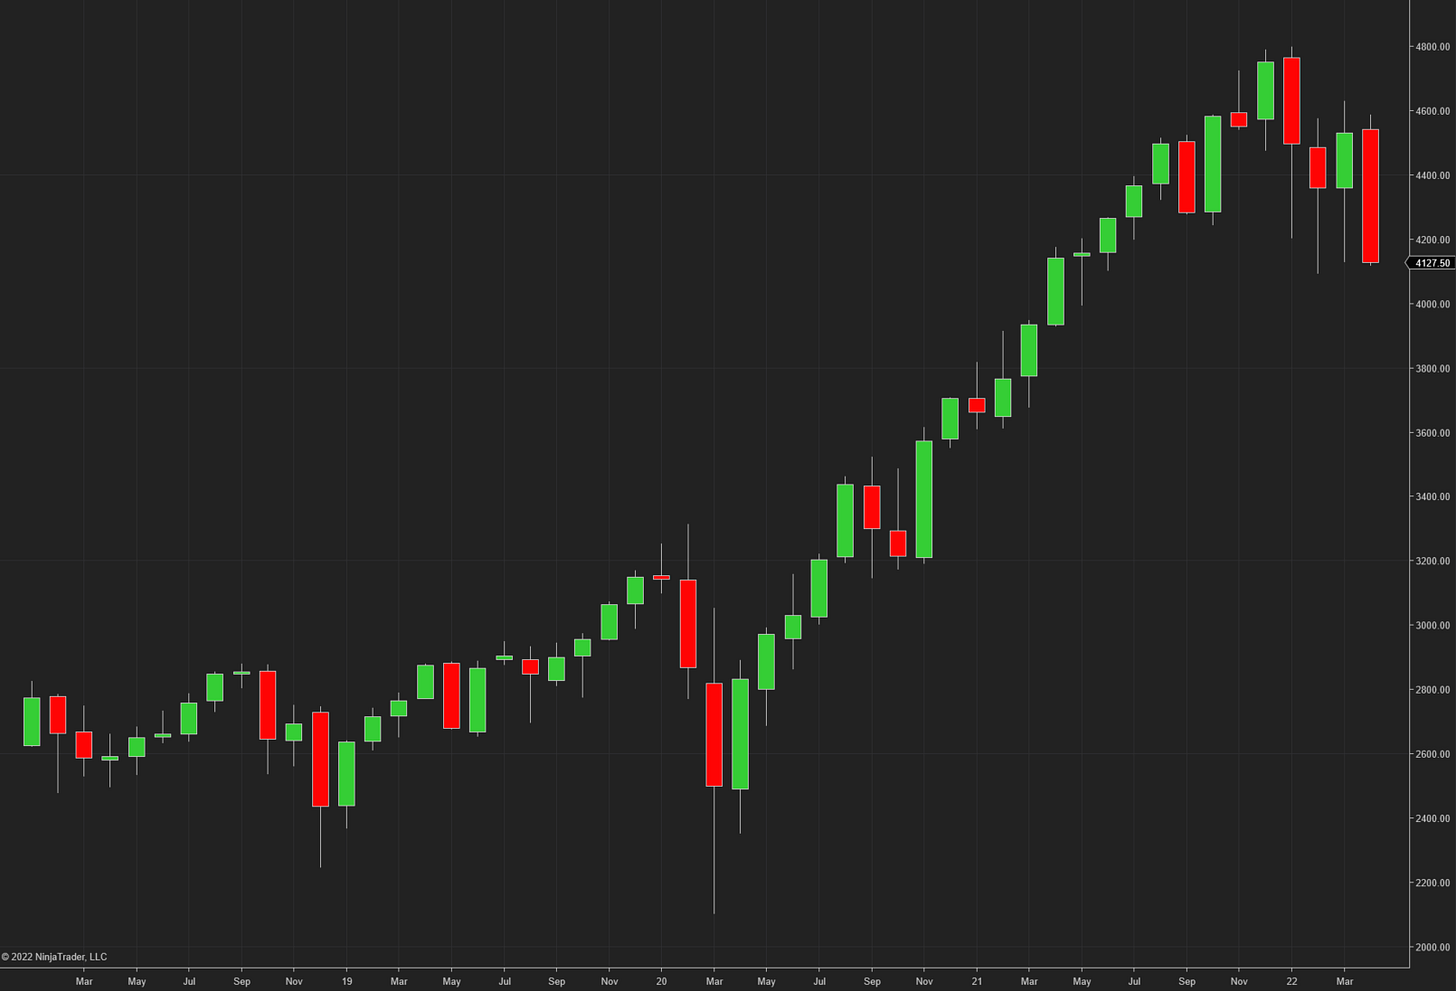
Monthly Change: -8.90%
April was an inside month for most of the month, however it just erased the March low. Month-over-month, ES is OTFD.
Nearby Highs: 4631, 4588.75 (current)
Nearby Lows: 4118.75 (current), 4101.75 (Feb ‘22 low), 4029.25 (May ‘21 low)
Weekly Change: -3.27%
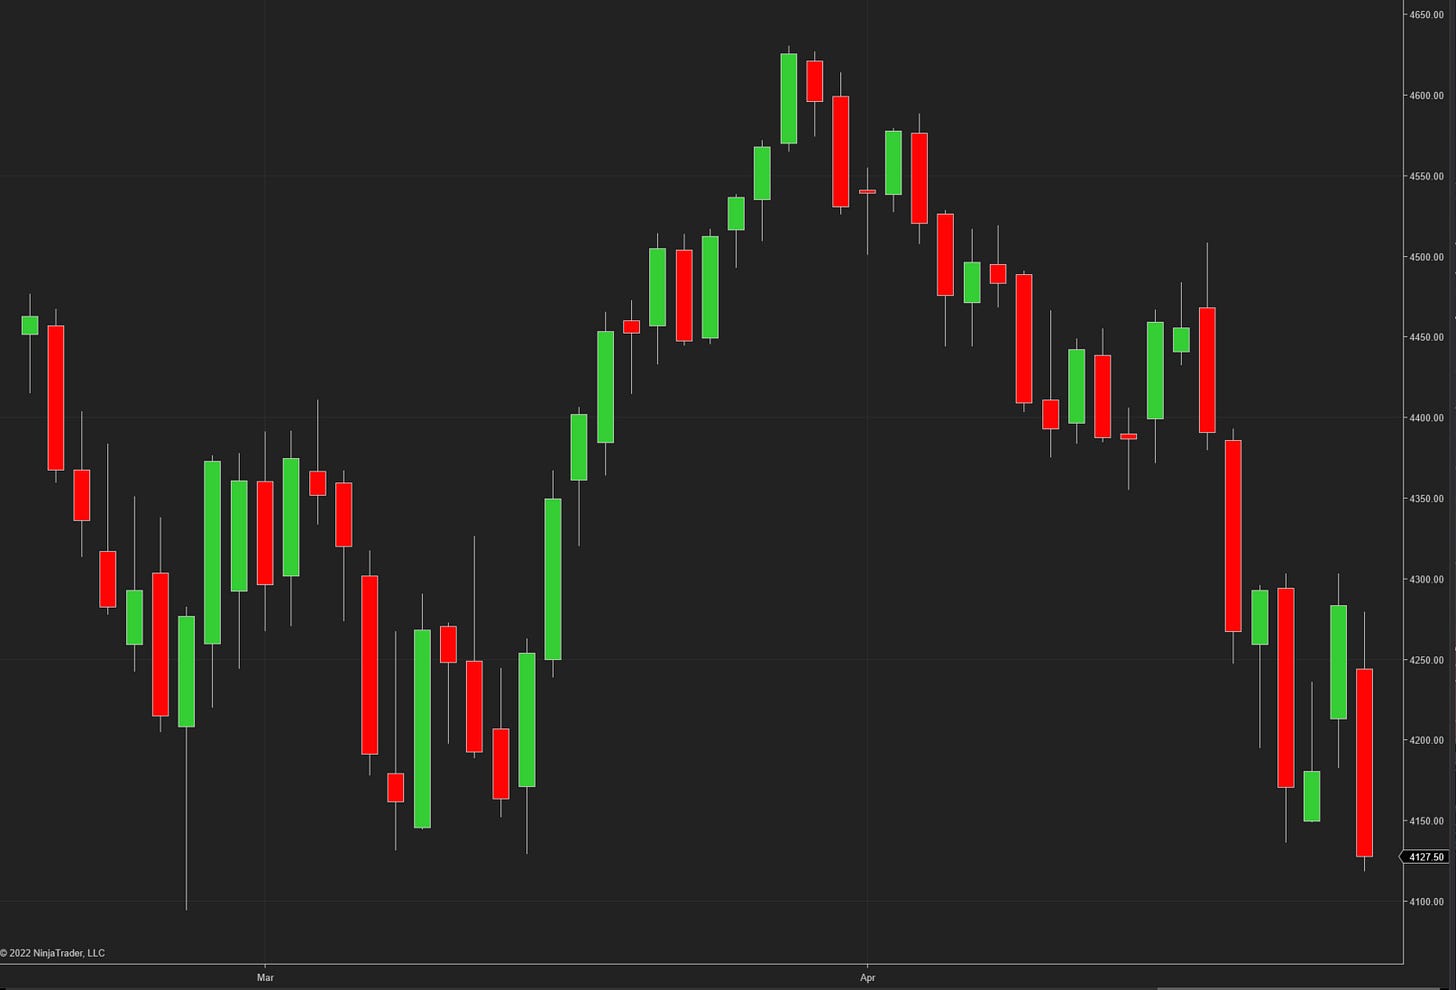
There have been lower lows for each week in April. April had every single week finish in the red. ES is also OTFD the past two weeks.
Nearby Highs: 4588.75, 4509, 4303.5 (current)
Nearby Lows: 4118.75 (current), 4101.75, 4055.5, 4029.25
Daily Change: -3.64%
ES traded in a channel last week. 4303.5 was the high which was tested twice and supply was met each time. 4118.75 was the low established on Friday, which erased several previous lows on the daily time frame. Downside targets from May 2021 are within reach.
Nearby Highs: 4393.25, 4303.5, 4279.75 (current)
Nearby Lows: 4118.75 (current), 4101.75 (2/24/22 LOD), 4084.5 (5/20/21 LOD), 4055.5 (5/19/21 LOD), 4029.25 (5/13/21 LOD)
Performance & Technicals
5-Day Performance
Technicals
ES Composite Volume Profile for the past five sessions:
ETH VAH: 4249
ETH VPOC: 4214
ETH VAL: 4165
ES RTH Volume Profile for today:
RTH VAH: 4211.25
RTH VPOC: 4130.75
RTH VAL: 4119.25
Prior Day RTH High and Low (Tomorrow’s T+2):
T+2 High: 4303.5
T+2 Low: 4182.5
Here is a chart of the past few sessions with a composite ETH Volume Profile:
Here is a chart of the past few sessions with daily ETH/RTH Volume Profile:
Here’s a TPO chart of today’s session with ETH/RTH Market Profile:
Friday’s RTH session left a poor high during the IB period. There were single prints between 4164.75 and 4171.75 and below 4125.75.
Session Recap
Electronic Trading Hours (ETH)
Overnight Session:
At Thursday’s close, wholesale was long with their position. After the NY close, inventory cleaned itself out a little but still remained above VWAP. The Friday ONO was inside of the prior day’s price range, in between the VAL and VPOC. In Globex, inventory was long above VWAP after the Japan open. During the London open, inventory began to correct short with supply moving the auction below VWAP slowly over the next few time periods. All trading in Globex remained below the prior day’s settlement and inside its value area.
ONO: 4244
ONH: 4279.75
ONL: 4230
ONRange: 49.75
Regular Trading Hours (RTH)
Initial Balance (IB) Session / US Open:
The RTH open was inside of Thursday’s price range and value area. It was also above the T+2 high. After the opening bell, the market was extremely choppy with swings of 10-20 points within the first 20 minutes. Towards the end of the first hour, the scales tipped in favor of long traders who bought the offer and raised ES up over VWAP. They could not get above the ONH or Thursday’s VPOC before being met with supply. Supply shoved the price down back below VWAP. ES continued the downward move, absorbed short covering and erased the ONL. It ended the IB period several points above the previous day’s VAL.
IBO: 4242.5
IBH: 4265.5
IBL: 4216.5
IBRange: 49
Remaining Session:
After the IB period, ES traded sideways for one hour. At this point, supply came and flushed the auction below Thursday’s VAL. For the next 60-90 minutes, shorts and longs were in balance. Longs made a last attempt to get back into Thursday’s value area but failed. Shorts shoved the auction lower over the next two hours and got beneath the 5-day composite VAL. In the last 20 minutes of NY trading, short traders sold ES down 40 points. Longs came in right at the closing bell to stabilize the price and end the free fall.


