
ESM22 Daily Debrief 04/12/2022

Market Overview
This morning, the March CPI report pegged inflation at 8.5%, the highest in 40 years. When this number was announced, equity futures ripped to the upside. However, the rally was short lived as ES and other indices sold off to finish the day in negative territory again. The Russell was the only stock index to register gains. Bond futures and crude were positive as well.

Here are some of today’s closing prices.

Top-Down Analysis
Monthly Time Frame: The April candle body has now come down more than 75% of the March candle body. Month-to-month ES is still OTFD (One Time Framing Down) as well as OTFU (One Time Framing Up) since February. The levels still remain. The February low was 4101.75. The March high was 4631 and the low was 4129.5.
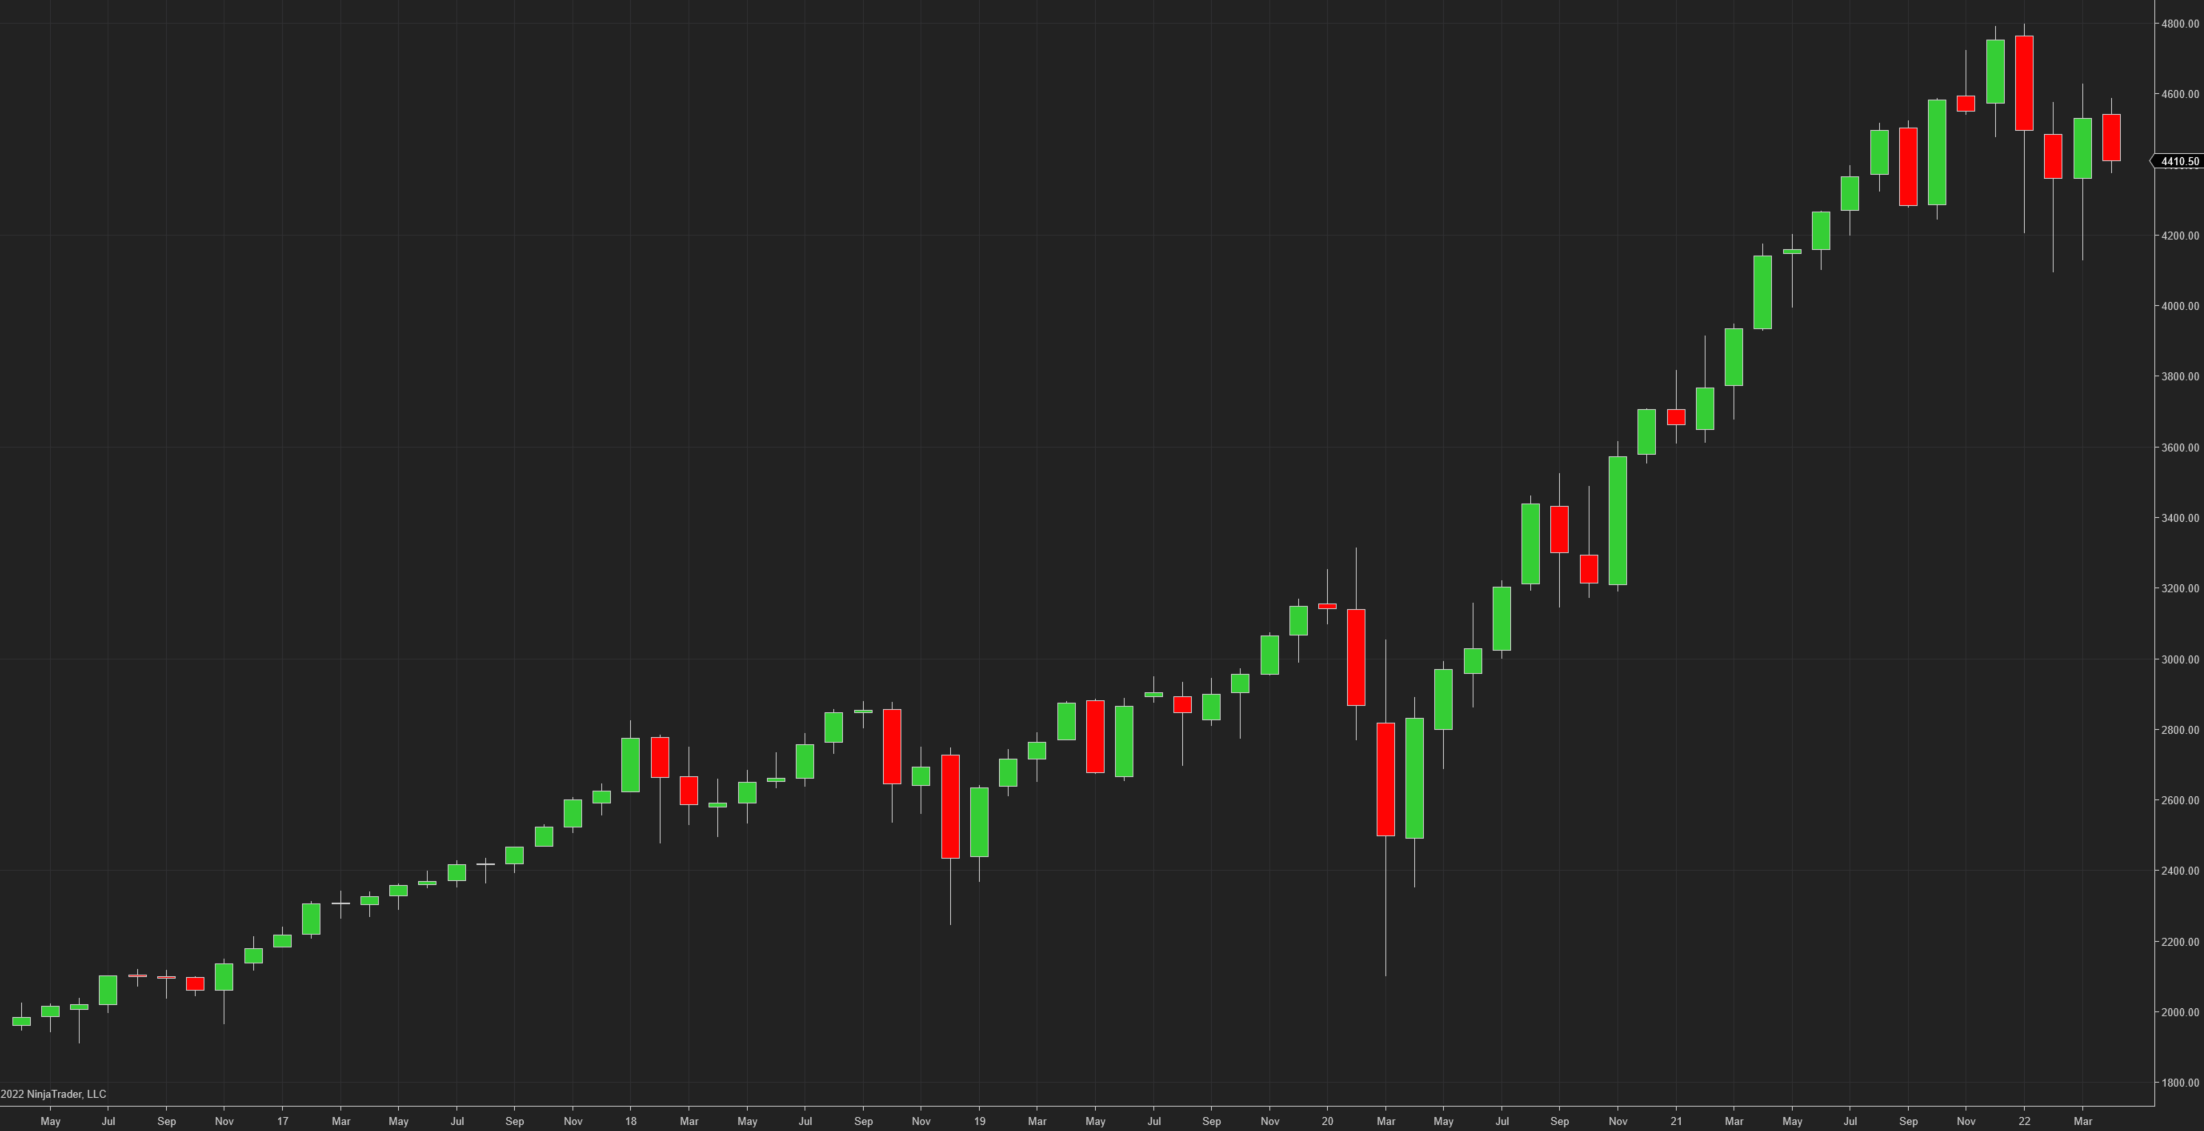
Weekly Time Frame: ES is still OTFD on the weekly chart. 4588.75 was the prior week’s high. The next weekly swing low is 4129.5.
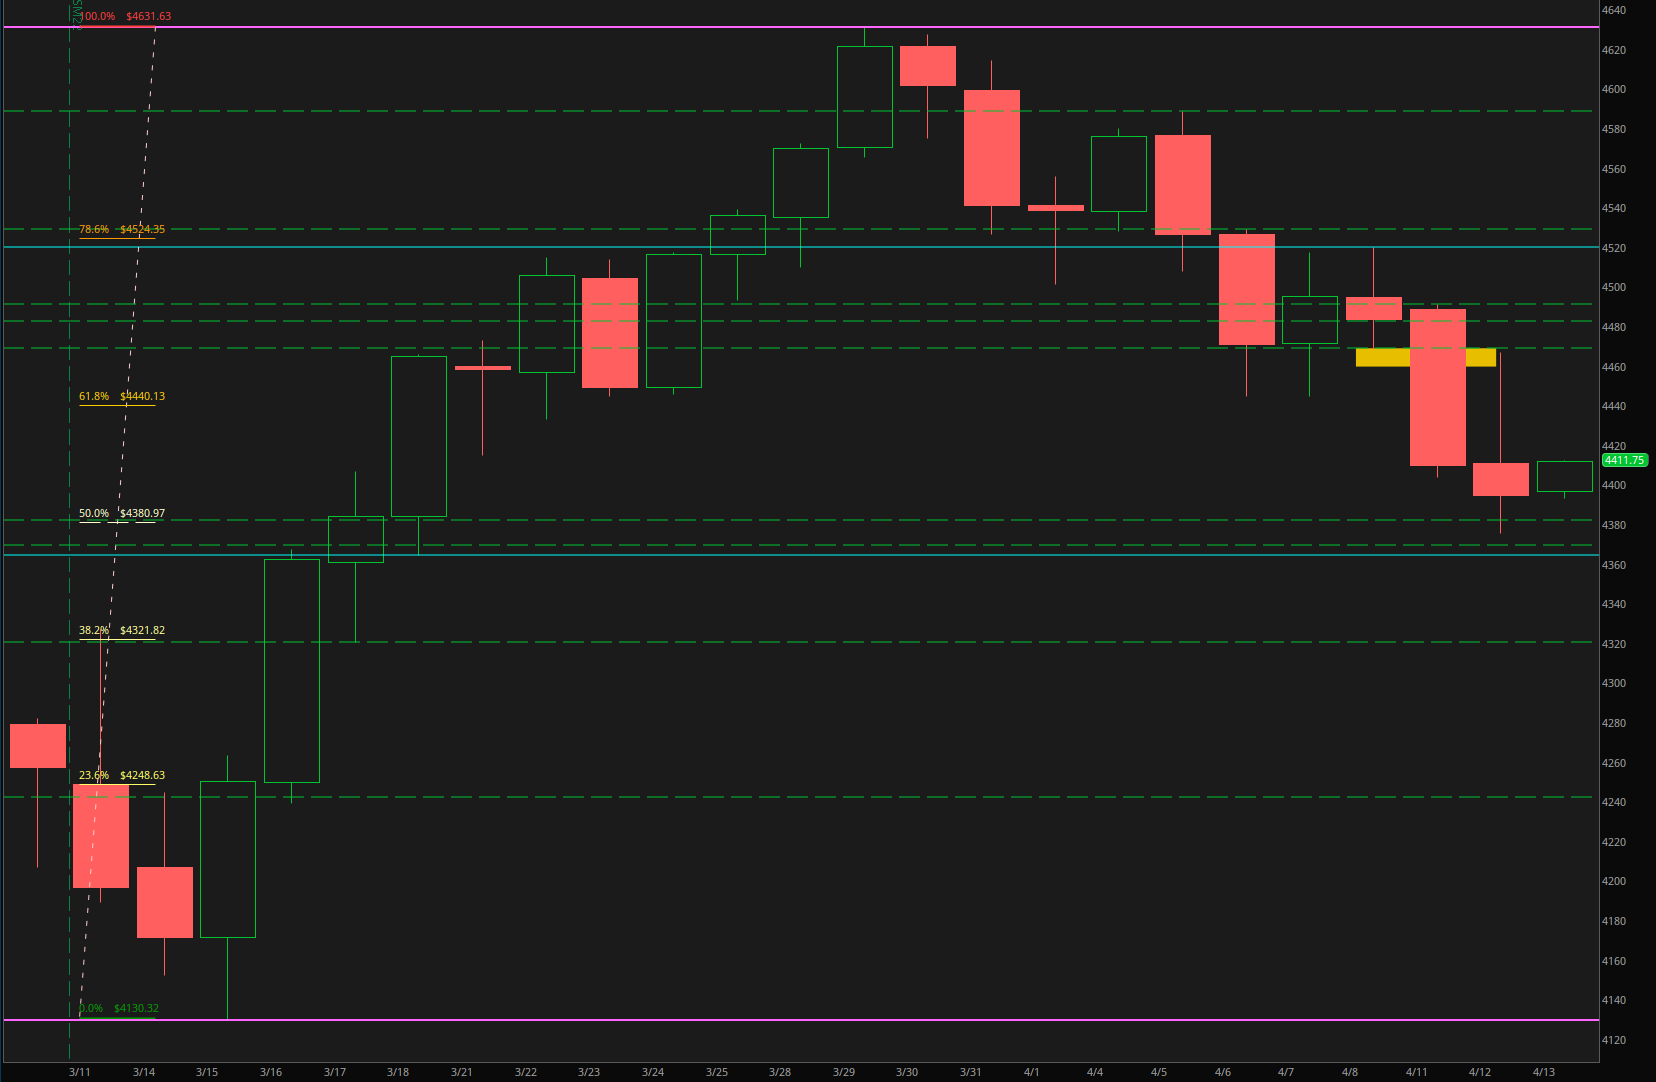
Daily Time Frame: Since hitting a high of 4631 on 3/29, ES continues to trend down. ES is OTFD the past three trading days and has been setting lower lows. ES briefly traded beneath the 4382.25 04/12 swing low before bidders pushed back above. The 04/08 swing low of 4468.75 acted as resistance today as ES tested this level but shorts front ran and moved the auction lower.
Performance & Technicals
5-Day Performance

Technicals

ES Volume Profile for today:
ETH VAH: 4464.50
ETH VPOC: 4450
ETH VAL: 4399.50
ES RTH Market Profile for today:
RTH VAH: 4462.5
RTH POC: 4432.50
RTH VAL: 4399.50
Prior Day RTH High and Low (Tomorrow’s T+2):
T+2 High: 4459.5
T+2 Low: 4403.5
Here is a chart of the past five sessions with ETH Volume Profile:
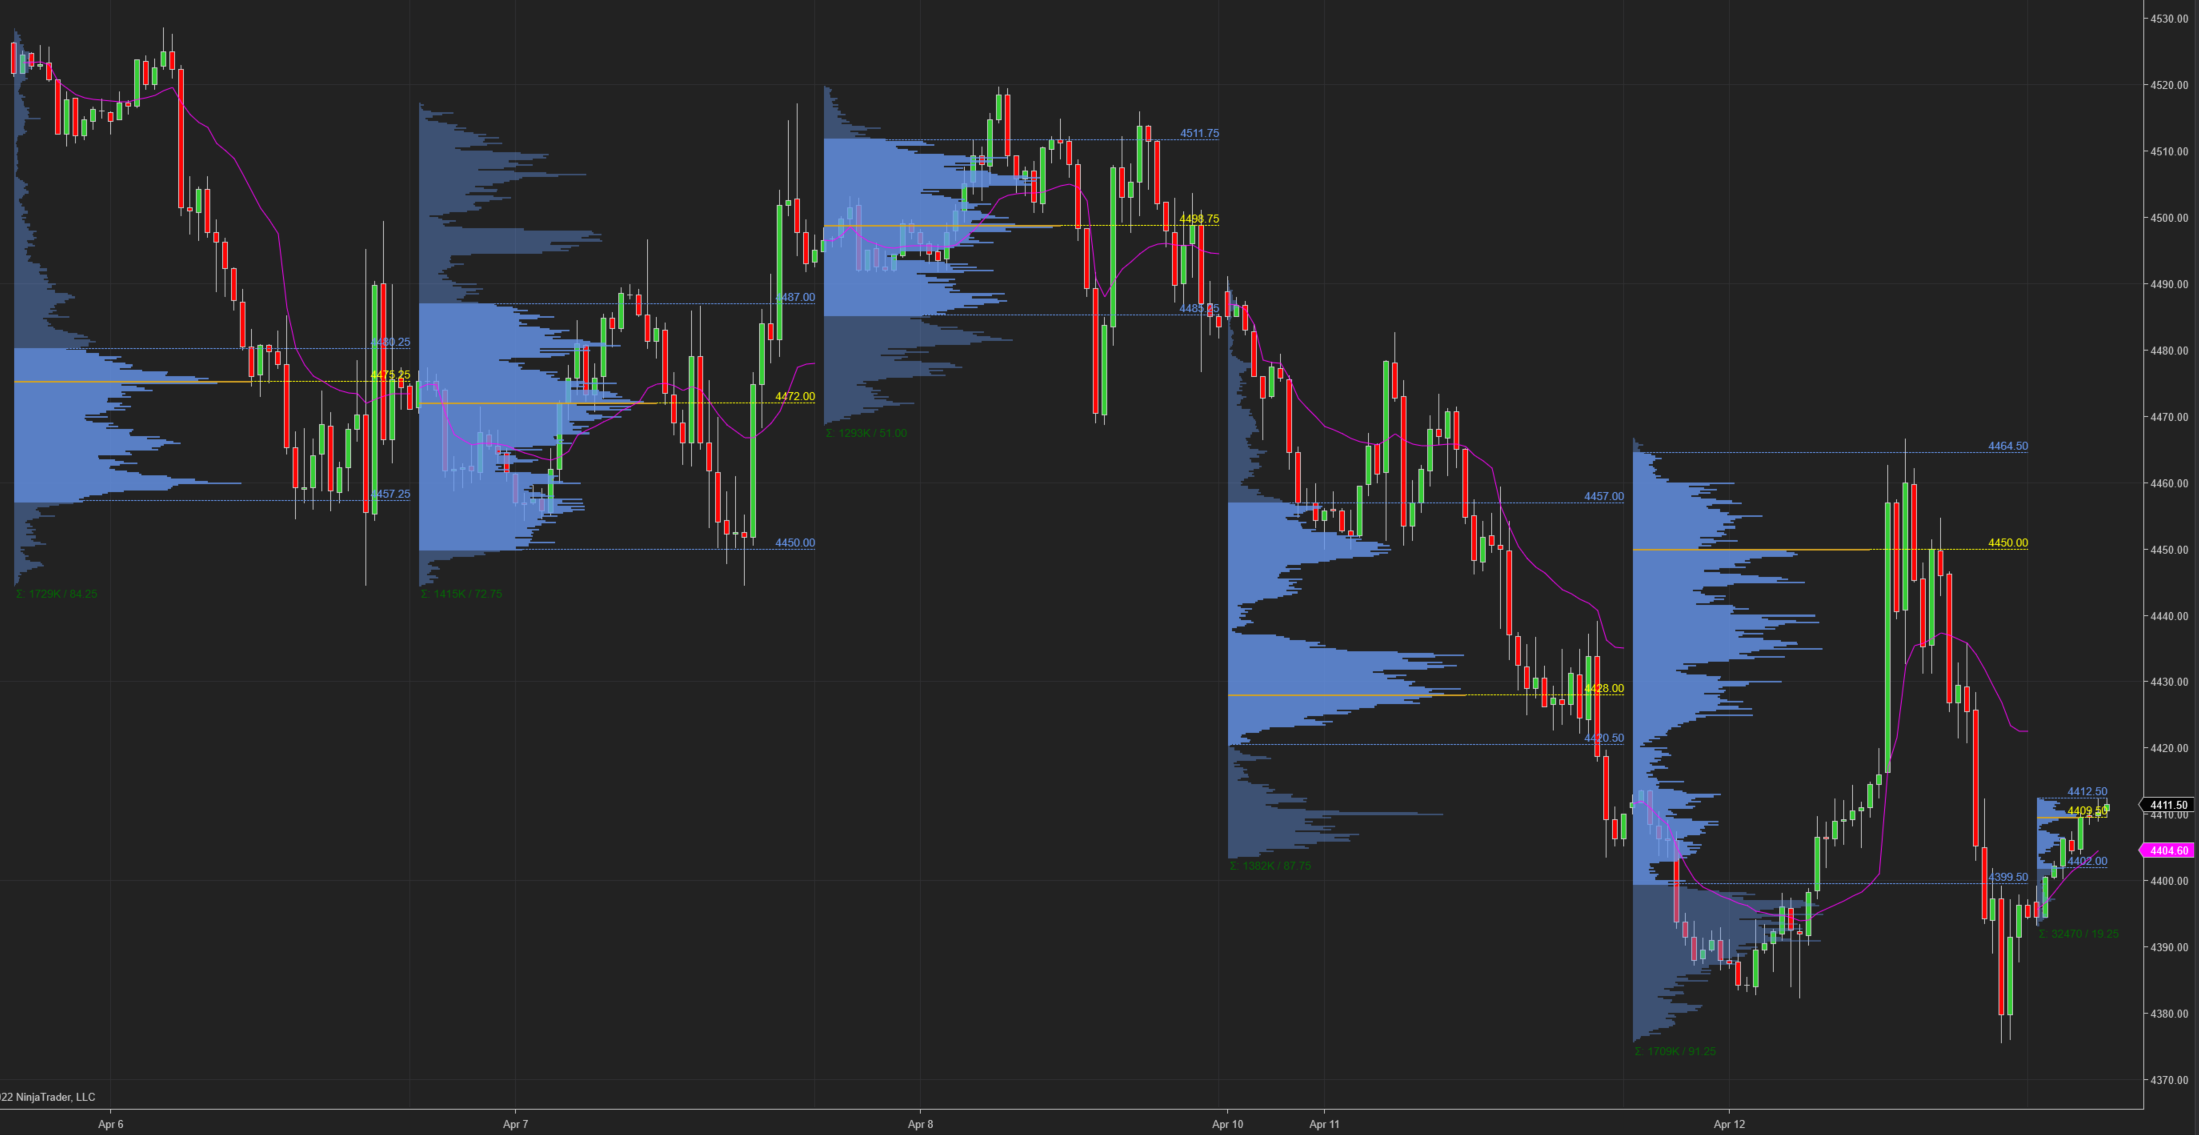
Here is a chart of the past five sessions with ETH/RTH Market Profile and Volume Profile:

4500.25 still remains a NPOC above.
Session Recap
Electronic Trading Hours (ETH)
Overnight Session:
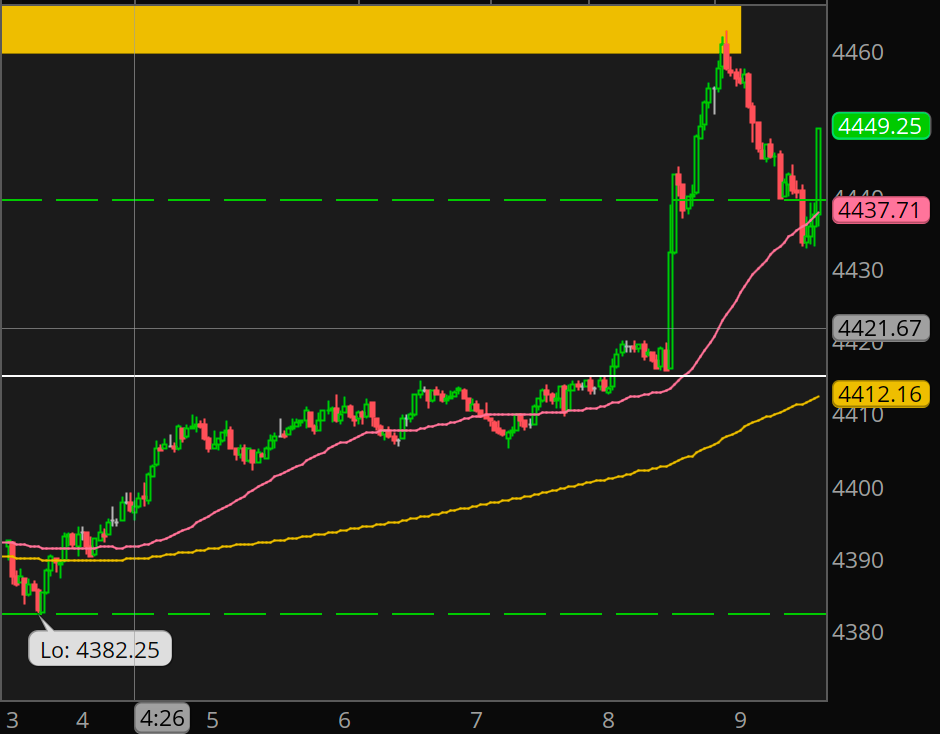
At yesterday’s close, wholesale was short. The ONO was below yesterday’s VAL, but there were no gaps as it opened within yesterday’s ETH price range. Inventory was short for much of Globex. About an hour after London opened, inventory began getting long and got up above VWAP. It continued and attempted to get inside the prior day’s VA. When the CPI number was released, ES shot up like a rocket and went completely through yesterday’s value area while it made new session highs. It traded into the gap made at yesterday’s RTH open but could not fill the whole gap. As the session neared the RTH open, the upside move began to correct.
ONO: 4411
ONH: 4462.75
ONL: 4382.25
ONRange: 80.5

Regular Trading Hours (RTH)
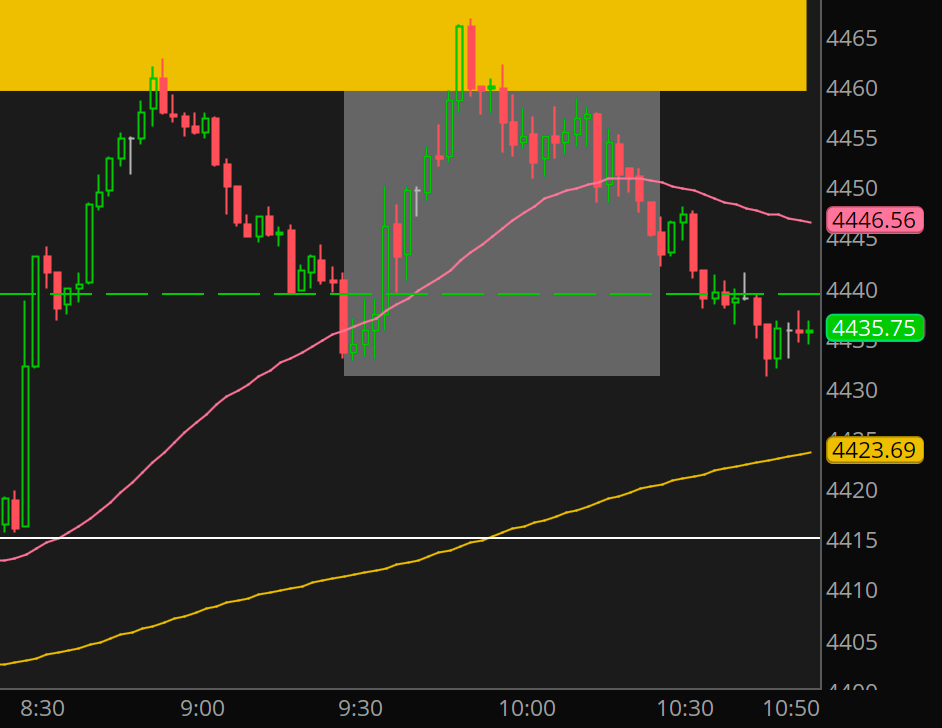
Initial Balance (IB) Session / US Open:
The RTH open was below the T+2 low. It was also inside the prior day’s RTH value area and price range. When IB period began, ES continued the downward corrective move before it hit its low for the IB. From here, supply ran out as longs bid the auction up further into the gap. The gap couldn’t quite get filled again when inventory began to absorb the buyers @ 4467 (several ticks shy of the top of the gap). Supply moved ES back down in price until the end of the IB period. This reversed more than 50% of the initial initiative move during A period in which ES tried and failed to get up and out of the previous day’s value area.
IBO: 4440.75
IBH: 4466.75
IBL: 4432.75
IBRange: 34
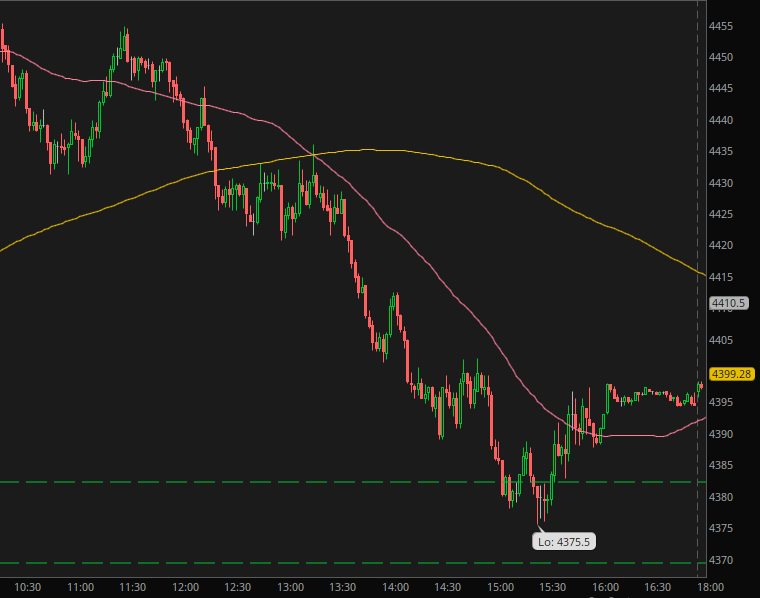
Remaining Session:
After the US open, ES still traded inside the price range for about two hours. After that, it broke the IBL and started trading in a range 10 points below for another hour. Then supply swallowed the buyers and moved the auction lower, beneath the previous day’s VAL. Once ES breached yesterday’s VAL, it crossed the ONO and sank 40+ points to a new LOD in negative territory. ES hit 4375.5 when supply ran out and longs began to cover. ES closed under 4400 for the first time since 03/16.
Links
Scott Galloway's take on the Elon and Tesla situation.
Ben Carlson explains why a balance between frugality and extravagance might be the best approach.
Liz Young looks at the current and potential future of the 60/40 portfolio.