
ESM22 Daily Debrief 04/01/2022

Market Overview
Three of the four major indices registered gains on Friday. The Nasdaq was the only one to begin April in the red. Crude and treasury futures fell with crude closing below 100. The 2s/10s yield curve inverted again and remained that way through closing.

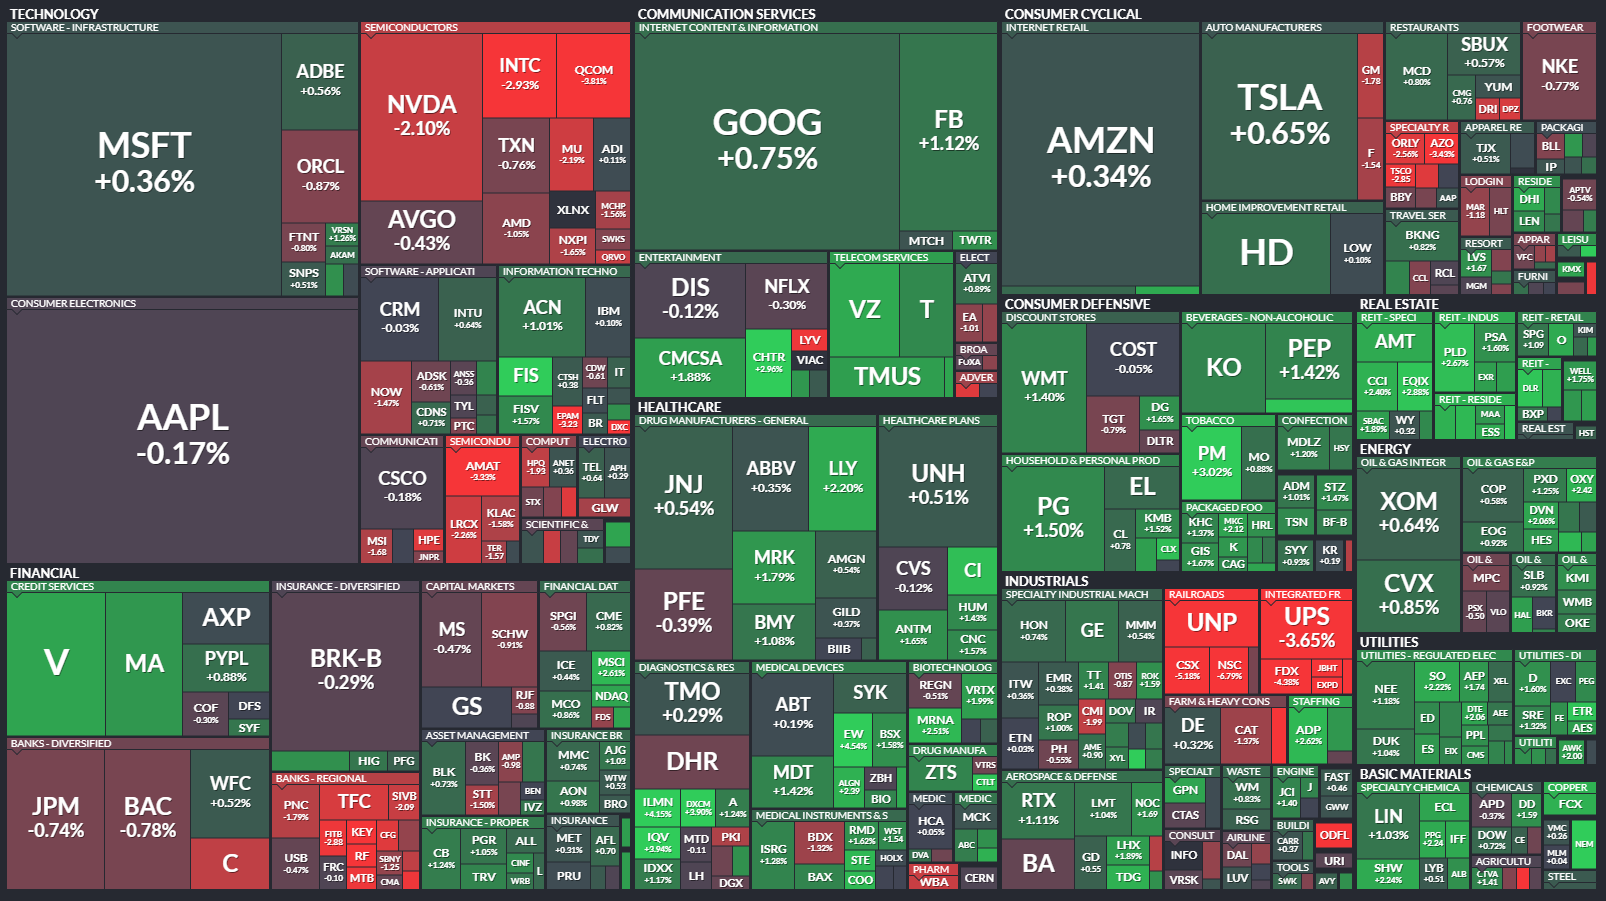
The S&P 500 heatmap from Friday:
Futures
S&P 500: 4539.25 (+0.19%)
Nasdaq 100: 14863.75 (-0.03%)
Dow Jones: 34718 (+0.29%)
Russell 2000: 2088.3 (+1.06%)
Crude Oil: 99.27 (-1.01%)
10 Year T-Note: 122’075 (-0.52%)
30 Year T-Bond: 149’26 (-0.17%)
Crypto
BTCUSD: 46296.34 (+1.69%)
ETHUSD: 3456.48 (+5.28%)
Interest Rates
US02Y: 2.46% (+5.26%)
US10Y: 2.39% (+1.88%)
US30Y: 2.44% (-0.61%)
Stocks (Top 5)
AAPL: 174.31 (-0.17%)
MSFT: 309.42 (+0.36%)
GOOGL: 2803.01 (+0.78%)
AMZN: 3271.20 (+0.35%)
TSLA: 1084.59 (+0.65%)
Top-Down Analysis
Monthly Time Frame: Here are the highs and lows of the past two months, which are currently OTFU. The February high was 4586 and low was 4101.75. The March high was 4631 and the low was 4129.5.

Weekly Time Frame: ES has broken out of a weekly downtrend which started the week of 01/03. For the past three weeks ES has been OTFU. ES will have to defend 4501.25 in order to continue the trend for a fourth week.

Daily Time Frame: It’s quite the opposite on the daily time frame. ES has been OTFD for the past four trading sessions. If Monday’s session fails to look above 4555.5, then this will continue. Friday’s candle is the third straight red candle following 9 out of 11 green candles going back to 03/15.

Performance & Technicals
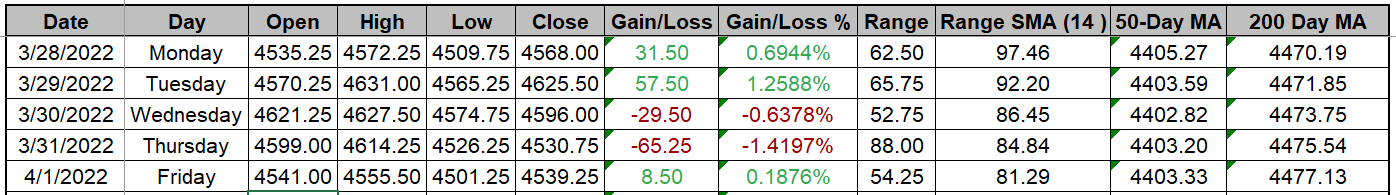
ES performance over the last 5 days:
ES Volume Profile from Friday:
ETH VAH: 4543
ETH VPOC: 4530.5
ETH VAL: 4517
RTH VAH: 4541.50
RTH VPOC: 4530.5
RTH VAL: 4519
Prior Day RTH Hi and Lo (Monday’s T+2):
PDHi: 4597.25
PDLo: 4526.25
Here is a chart of the past five sessions with ETH Volume Profile:
Here is a chart of the past five sessions with RTH Volume Profile:

Volume-wise, the profile was D-shaped and had the 2nd smallest range for the past 5 days. The value area was nearly identical to Monday’s value area. Below is a chart with market profile and volume profile. There’s a naked market profile POC @ 4582.25 to keep an eye on.

Session Recap
Electronic Trading Hours (ETH)
Overnight Session:
ES ended Thursday’s session short. There were traders trapped both long and short at the end of the day. The ONO was inside of the prior day’s range, but below the prior day’s value area and T+2 low. There were no gaps at the open. Overnight inventory was balanced. ES traded below, around and mostly above VWAP throughout the ON. Heading into RTH, supply was beginning to liquidate from the ONH. The NFP figures were released and the market did not have a strong reaction to the news.
ONO: 4541
ONH: 4555.5
ONL: 4536.5
ONRange: 19
Regular Trading Hours (RTH)
Initial Balance (IB) Session / US Open:
The US open was within the prior day’s price range and below the value area and T+2 low. The starting 5 were down initially while RTY was up so breadth showed that more companies were a tick up. The auction was slow and there were no big outside sellers. The auction trended downward throughout the IB period with lower highs and lower lows. Responsive longs were easily absorbed by supply as ES sank below the ONL as well as Thursday’s LOD.
IBO: 4543.5
IBH: 4545
IBL: 4518
IBRange: 27
Remaining Session:
After the US open, longs attempted to bid the auction up and out of the downtrend and then hit resistance at 4534.50. For the next few hours, shorts were able to absorb any and all buying to continue to push ES lower. At 4501.25 supply shut off and shorts began to cover. ES rose about 40 points from this level during the final hours of RTH, enduring moments of backfill in the process. ES closed the session and week in positive territory.
Links
Sam Ro highlights a 1994 Peter Lynch observation and expands on how it hit the mark.