
ESM22 Daily Debrief 03/25/2022

Market Overview
Stocks ended the week strong to cap another positive week. Some of the mega-caps struggled but many sectors ended positive. Crude futures rose as bond futures fell to end the week. Volatility was down for much of the week as the VIX fell almost 13%, following last week’s 22% drop.

Futures
ESM22: 4536.5 (+0.53%)
NQM22: 14755.75 (-0.05%)
YMM22: 34759 (+0.45%)
RTYM22: (+0.21%)
CLM22: 113.90 (+1.39%)
ZNM22: 121’175 (-1.12%)
ZBM22: 147’02 (-1.53%)
Stocks (Top 5)
$AAPL: 174.72 (+0.37%)
$MSFT: 303.68 (-0.14%)
$GOOGL: 2833.46 (+0.07%)
$AMZN: 3295.47 (+0.68%)
$TSLA: 1010.64 (-0.62%)
Top-Down Analysis
Monthly Time Frame: On the monthly time frame, the last two week rally has the March candle creeping towards the February high @ 4586. The March low of 4129.5 seems so far away. Does ES continue to rally and take out the Feb high or does a seller appear to cool things off?

Weekly Time Frame: On the weekly time frame, ES has been green in four of the past five weeks. Since the Russian invasion of Ukraine, ES has been making higher highs and higher lows on the weekly chart. The volatility was noticeably down this past week as the price range for ES was less than half of the prior week. The 4585 swing high from the week of 2/7 is the next critical level on the upside. On the downside, this week’s open @ 4460 and low of 4415 are areas to keep an eye on.

Daily Time Frame: On the daily chart, ES was OTFU for several sessions before balancing in the middle of this week. Today it continued to OTFU. The past five sessions failed to give us a price range greater than 100 points as volatility and the VIX have come down. The 2/10 high @ 4583.75 is the next upside target. On the downside, the prior day’s low @ 4445.75 is an area to watch.

Performance & Technicals
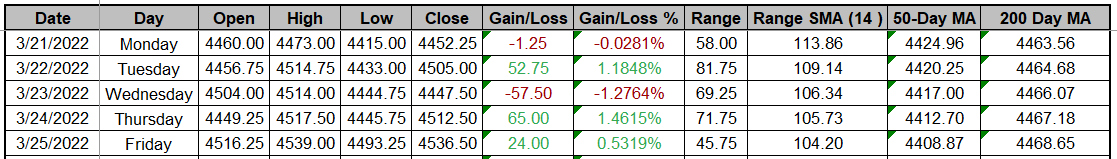
ES performance over the last 5 days:
ES Volume Profile for today:
ETH VAH: 4528.50
ETH VPOC: 4509.50
ETH VAL: 4506
RTH VAH: 4529.50
RTH VPOC: 4509.50
RTH VAL: 4506
Prior Day RTH Hi and Lo (Tomorrow’s T+2):
PDHi: 4517.25
PDLo: 4456
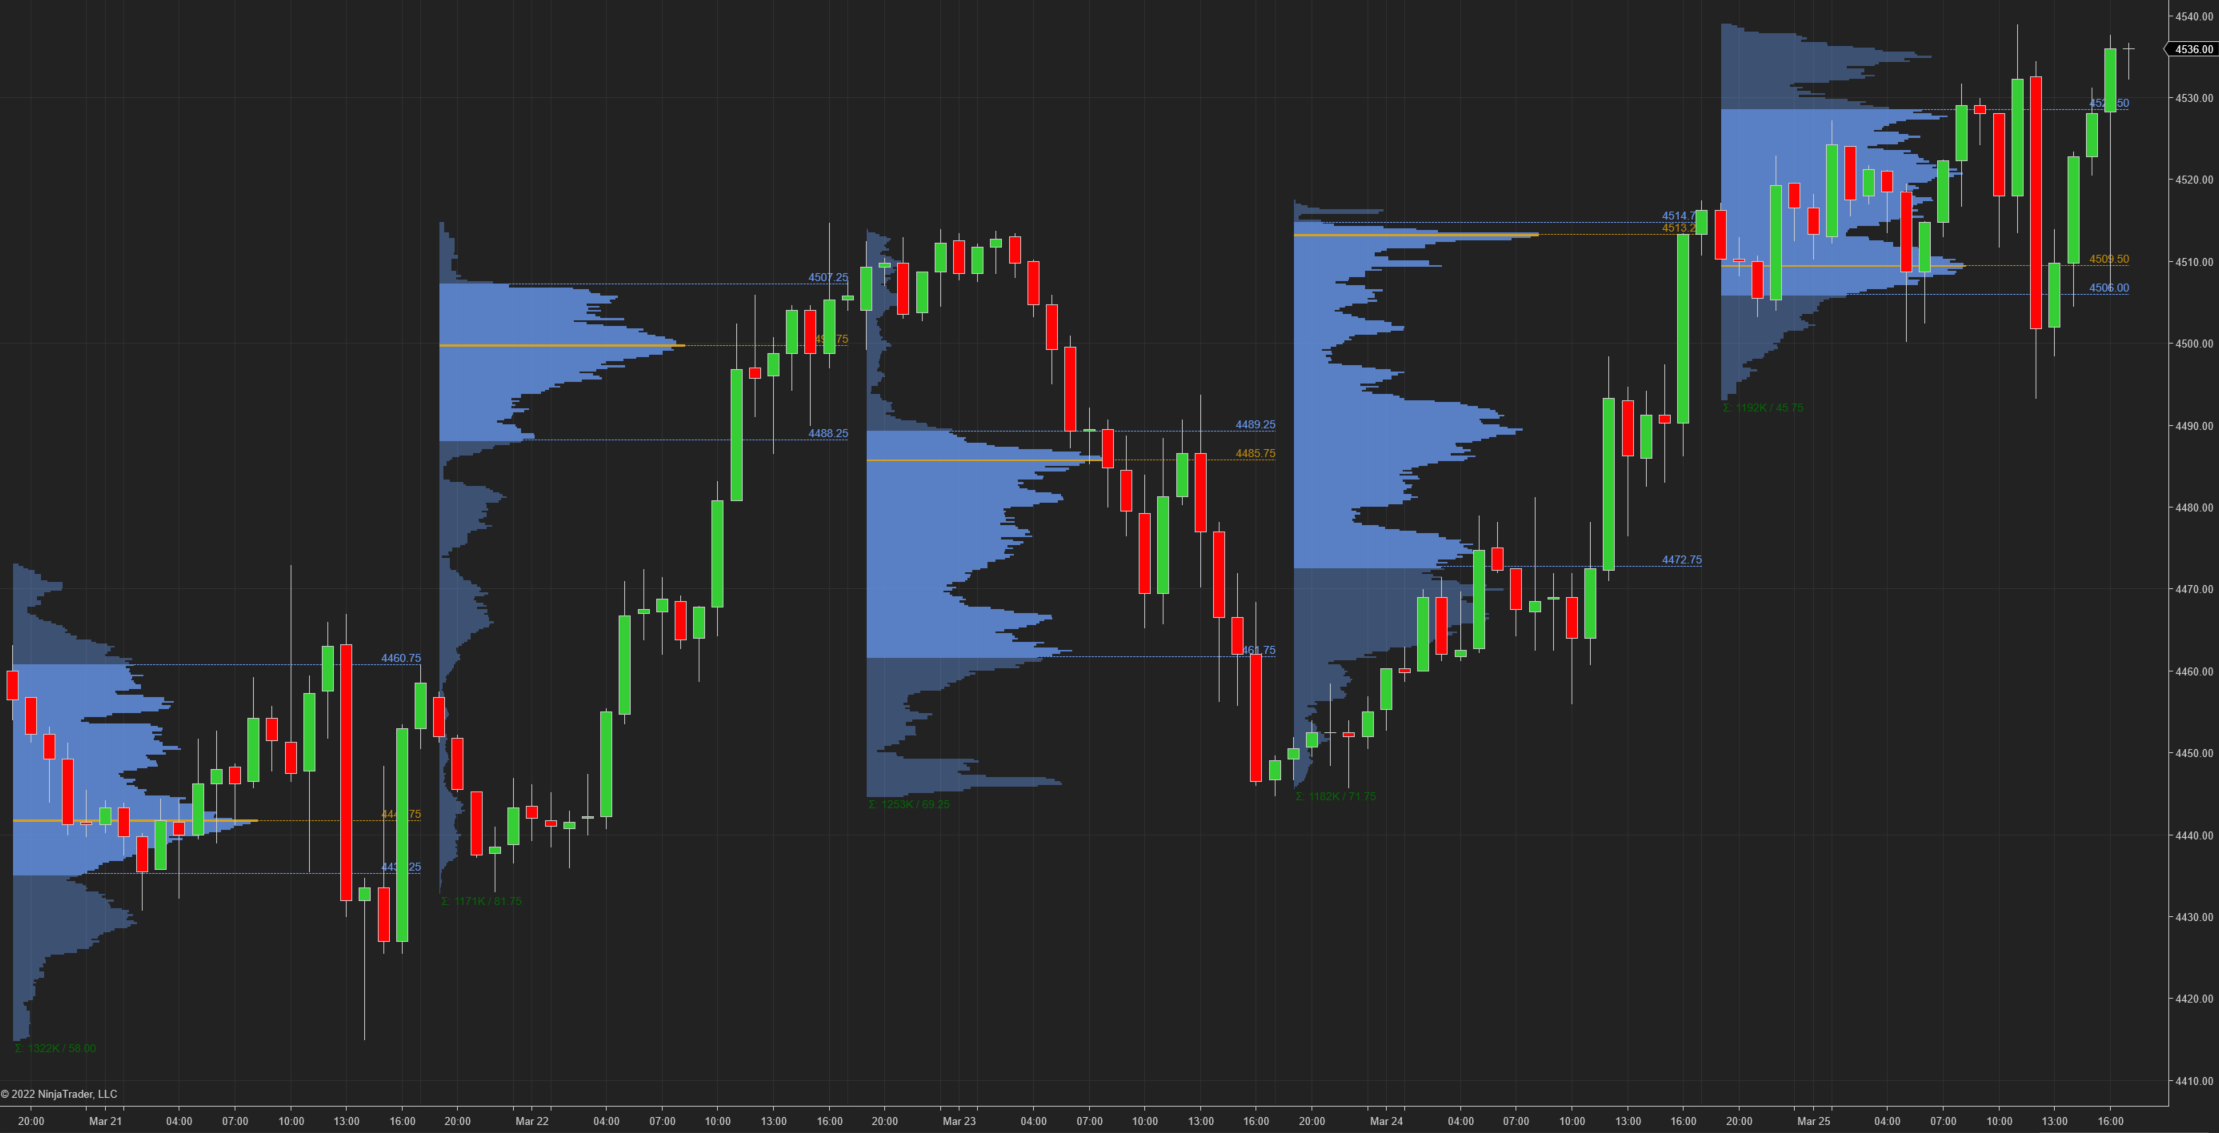
Here is an hourly chart of the past five sessions with ETH Volume Profile:
Session Recap
Electronic Trading Hours (ETH)
Overnight Session:
At yesterday’s close, wholesale was long. The open was inside of the prior day’s price range and slightly above the VAH. It was also above the T+2 high. Overnight inventory was balanced for most of the overnight session but got long heading into RTH. ES traded back and forth inside a 30 point range while rotating in and out of the PDVA and criss crossing today’s VWAP.
ONO: 4516.25
ONH: 4531.75
ONL: 4500.25
ONRange: 31.5
Regular Trading Hours (RTH)
Initial Balance (IB) Session / US Open:
The RTH open was above the prior day’s trading range and VAH. The IB period was very choppy and remained within a tight range. The market internals were mixed and did not indicate any direction or momentum. Most of the IB period traded within a 14 point range. A stop run late in the period moved the auction up and took the ONH to expand the IB range. Supply and backfill moved the auction back down again. The IB period closed about 7 points higher from the RTH open.
IBO: 4520.25
IBH: 4534
IBL: 4511.75
IBRange: 22.25
Remaining Session:
Right after the US open, longs absorbed some selling and moved the auction up to a new HOD @ 4539. Supply was met and longs got trapped. Shorts overwhelmed the bid to push ES down towards the middle of yesterday’s VA and supply shut off @ 4493.25. Longs pushed ES up and over the prior day’s VAH, absorbing whatever selling it faced along the way. The auction continued to move up until longs could no longer absorb the selling and inventory at 4531.25. The auction fell almost 30 points. Finally, supply shut off at 4506.5 and longs moved the auction up to regain the 30 points before balancing to end the session.