
Daily Digest 10/20/2020
Treasury yields continued to pressure equities with their climb to new YTD highs. Existing home sales fell in September. UK Prime Minister resigned after only a month in office.

Market Overview

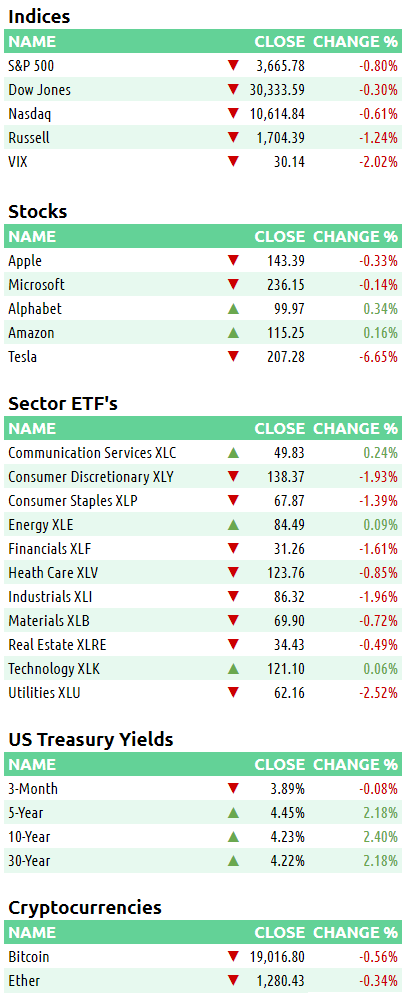
Every index reversed gains from earlier in the day to finish red again. The VIX also retreated but remained above 30 at the close. The Russell was the worst while the Dow held up the best again, only losing 0.30%. The S&P was up by as much as 1.1%, but finished down 0.8%. Three S&P sectors were green for the day with communications XLC 0.00%↑ leading the way. Utilities XLU 0.00%↑ was the worst performing sector. With Friday on deck, it’s worth noting that the S&P has sold off in 8 of the past 10 Fridays.
US Treasuries continued to hit new YTD highs. The 3-month bill ended flat. The 2-year note gained 1.07% to finish at 4.61%. The 10-year note was up 2.39% to close at 4.23%.
The US Dollar index dropped 0.02% and closed at 112.87.
The NYSE Advance/Decline ratio was at +5 standard deviations in this recent rally. Read about it here to see what that could potentially signal.
After taking office a little more than a month ago, UK Prime Minister Liz Truss has resigned. This comes weeks after her proposed fiscal policy caused turmoil to Britain’s financial markets and caused the Bank of England to intervene. An excellent breakdown of what happened can be watched here.
Here are some of today’s closing prices.
E-mini S&P 500 Top-Down Analysis

Below are the monthly (5-years), weekly (2-years) and daily (6-months) charts for ES.

M/M: ES is OTFD as it failed to take out the prior month’s high and has traded and closed below the prior month’s low.
W/W: If ES can remain above 3502, it will be OTFU on a weekly basis.
D/D: For the 2nd straight session, ES failed to eclipse the previous day’s high. ES is OTFD inside a larger balance area. ES has spent plenty of time from 3665 through 3777 this week.
E-mini S&P 500 Metrics
Recent History and Performance

Technicals

E-mini S&P 500 Volume/Market Profile
ES Composite Volume Profile (5 days)
Here is a chart of the past five sessions with a composite ETH Volume Profile:

ES ETH/RTH Split Volume Profile (5 days)
Here is a chart of the past five sessions with a daily ETH/RTH split Volume Profile:
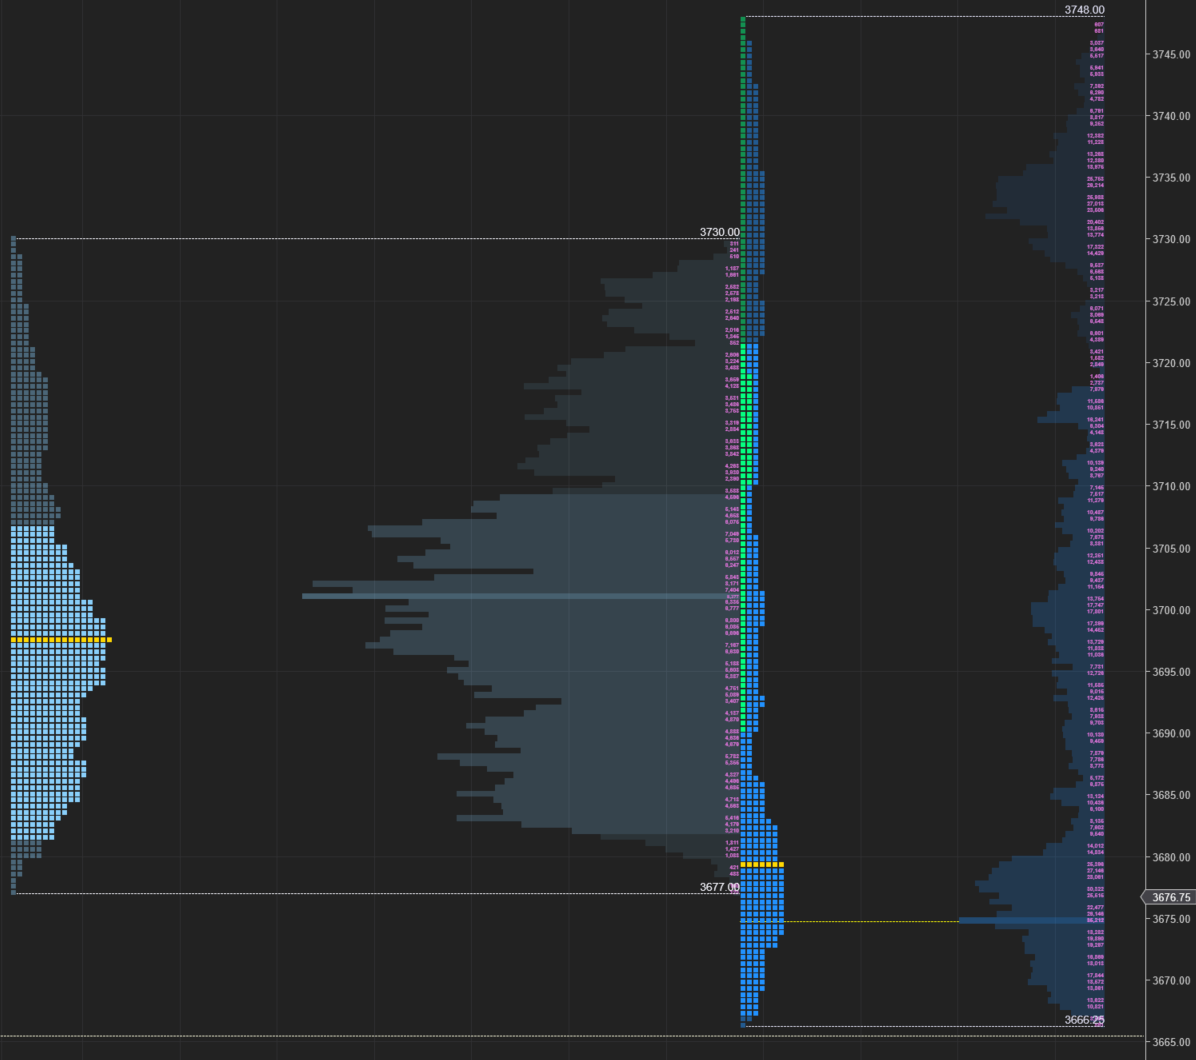
ES ETH/RTH Split Market/Volume Profile (today)
Here’s a TPO chart of today’s session with ETH/RTH split Market/Volume Profile:
ES Market/Volume Profile Levels

RTH Weak High/Low: n/a
RTH Single Prints: n/a
RTH Excess: 3666.25 to 3667; 3746 to 3748
RTH Gap: n/a
Session Recap
Electronic Trading Hours (ETH)
Globex Session:
Wholesale was short at the prior day’s close. The ONO was inside of the prior day’s value area. Inventory during Globex was mostly short beneath the prior day’s RTH close, roughly 84% of the time. Supply and a lack of demand pressured ES lower. The auction eventually fell under the prior day’s value area but there wasn’t enough supply to take out the bid near the prior day’s LOD. After failing to take out the prior day’s low, inventory corrected and got long momentarily. At 3719, supply was met and then inventory reversed and got short. At 3680.25, buyers stepped in to lift ES and inventory corrected long again. ES took out the prior session high and briefly eclipsed the prior day’s VAH. At 3730, supply was met again and ES rotated down to VWAP.
The ON price action was entirely inside of the previous day’s RTH range. There was a lack of follow through in either direction. In the larger picture, ES remained in balance. VPOC in Globex was 3701.75.
Range: 53
Regular Trading Hours (RTH)
US Session:
The RTH open was inside of the prior day’s value area and T+2 low. Buyers were able to absorb supply initially at the NYSE open. They elevated ES about 60-points to get above the ONH and prior day’s HOD. Buyers scattered at 3748, which was +2 standard deviations above VWAP, where a plethora of offers were present. From C through J-period, ES was OTFD in a 80-point drop. The pressure from sellers moved ES below the ONL, prior day’s LOD and T+2 low. At 3666.25, roughly -2 standard deviations beneath VWAP, supply shut off and short covering stabilized ES into the close.
Today’s RTH range completely encapsulated the prior day’s range. Wholesalers saw a bid early in the session and cut off supply. This allowed large traders to unload inventory above VWAP. When demand began to fade amid an abundance of supply, ES fell underneath VWAP again. The auction kept falling until buyers finally came into the picture. Wholesalers were able to acquire inventory late in the afternoon. This was evident when VPOC fell and the highest volume node developed near the bottom of the profile.
Range: 81.75