
Daily Digest 10/18/2022
Equities up. Treasuries and the US Dollar index down. Goldman Sachs and Netflix headline some of the companies with strong earnings.

Market Overview


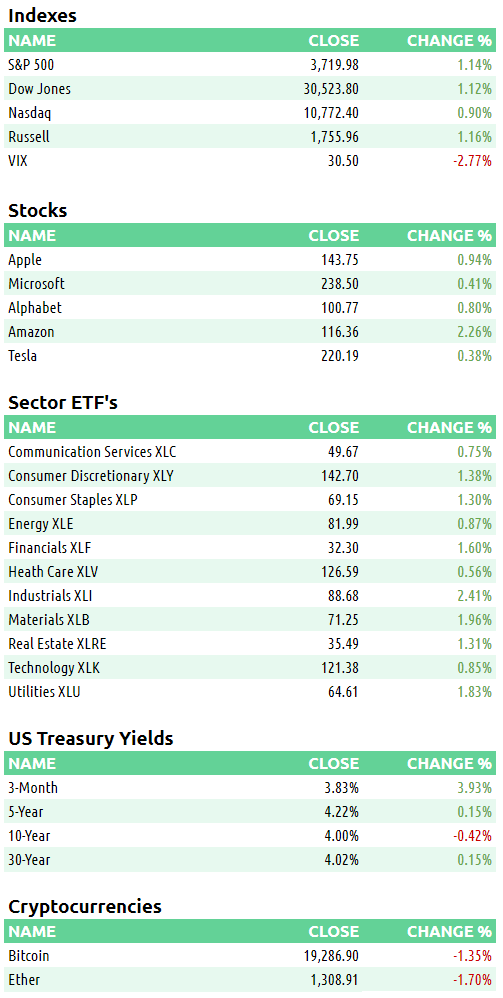
Every index was green today. The VIX fell for the 2nd straight day and has been in a downtrend since last Wednesday’s intraday high. Every sector in the S&P was up again with industrials XLI 0.00%↑ leading the way. In individual names, Carnival Corp CCL 0.00%↑ was the top ticker while Moderna MRNA 0.00%↑ was the biggest loser. If things continue, the S&P index is on pace to close above its 200 week EMA after dipping beneath the indicator three weeks ago.
US Treasuries continued to be a mixed bag. The 3-month bill and 30-year bond were up today. The 2-year note fell 0.27% to 4.435%. The 10-year lost 0.1% to 4.011%.
After rising immediately after Thursday’s CPI reading, the US Dollar index $DXY has fallen in 3 out of the last 4 days. It closed today at 111.99.
Goldman Sachs GS 0.00%↑ and Netflix NFLX 0.00%↑ both beat on top and bottom lines today.
Bloomberg Economics sees a 100% chance of a recession in the next 12-months.
Here are some of today’s closing prices.
E-mini S&P 500 Top-Down Analysis
Below are the monthly (5-years), weekly (2-years) and daily (6-months) charts for ES.

M/M: ES is OTFD as it failed to take out the prior month’s high and has traded and closed below the prior month’s low.
W/W: If ES can remain above 3502, it will be OTFU on a weekly basis.
D/D: ES opened above the prior day’s high. It traded inside yesterday’s range momentarily before buyers pushed the auction higher. ES is OTFU. 3820 is the next key level to get over if this rally is to continue.
E-mini S&P 500 Metrics
Recent History and Performance

Technicals

E-mini S&P 500 Volume/Market Profile
ES Composite Volume Profile (5 days)
Here is a chart of the past five sessions with a composite ETH Volume Profile:

ES ETH/RTH Split Volume Profile (5 days)
Here is a chart of the past five sessions with a daily ETH/RTH split Volume Profile:

ES ETH/RTH Split Market/Volume Profile (today)
Here’s a TPO chart of today’s session with ETH/RTH split Market/Volume Profile:

ES Market/Volume Profile Levels

RTH Weak High/Low: n/a
RTH Single Prints: n/a
RTH Excess: 3697.25 to 3703; 3766.50 to 3777.25
RTH Gap: n/a
Session Recap
Electronic Trading Hours (ETH)
Globex Session:
Wholesale was long at the prior day’s close. The ONO was above the prior day’s HOD. Supply was lacking so inventory during Globex was 100% long. The auction never traded down inside the prior day’s range. After being flat for the first few hours, demand came in and lifted the offer above the T+2 high. ES closed the 10/07 gap and reached 3762.75 before correcting to backfill demand. On the backfill, supply shut off at 3723.50 and ES rotated back up and over the previous swing high of the session. Globex VPOC was 3750.
Range: 70
Regular Trading Hours (RTH)
US Session:
The RTH open gapped up and was above the prior day’s high and T+2 high. Leading up to the NYSE open, buyers had been making new session highs. After the opening bell, buyers struggled to follow through in getting beyond the ONH. It broke by a handful of ticks but at 3777.25, the offer could no longer be lifted. Supply moved ES down 40-points in the first hour of trading. After struggling to accept underneath VWAP, shorts were able to absorb any responsive buys and continued lower. ES was one time framing down (OTFD), failing to trade above the previous candle’s high, from A through E-period. ES momentarily fell into the prior day’s value area but supply shut off at 3697.25. Shorts covered and brought ES above the prior session’s range again. The auction began one time framing up (OTFU), failing to trade below the previous candle’s low, for the next few TPO-periods. At 3746.50, there was supply and short covering stopped. ES reversed to the downside again. Sellers couldn’t take out the bid at 3703.25. Buyers lifted ES nearly 60-handles to finish the day above 3750. Wholesalers continue to find the bid and distribute above VWAP.
Range: 80