
Daily Digest 10/17/2022
Equities continue to whipsaw back and forth. Nasdaq has best day since July.

Market Overview
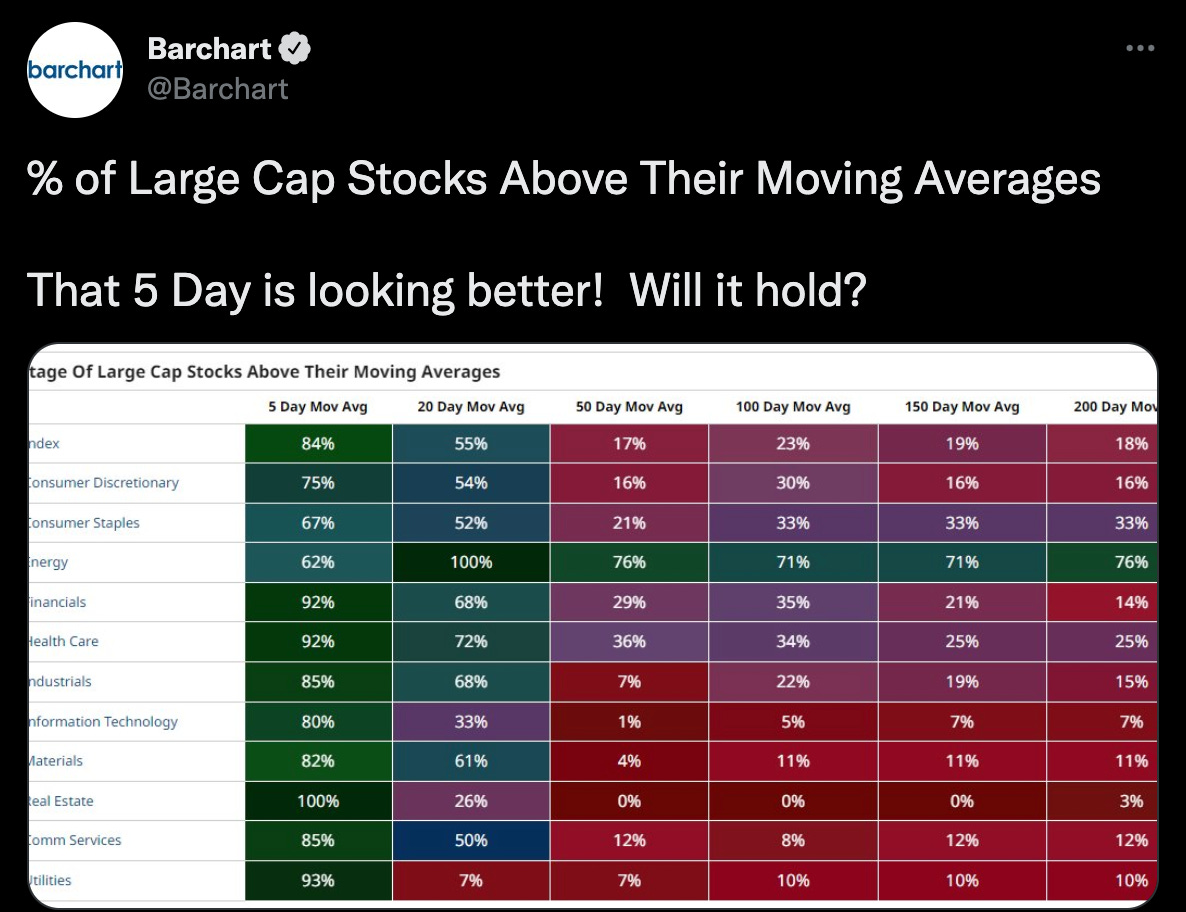
Every index was green on the day led by the Nasdaq. The S&P has had greater than two percent moves in each of the past three trading days (+2.60%, -2.37% and +2.65%). The last time it had such a streak was this past June 9th through 13th, days before it set the summer 3666.76 low which preceded a 17% rally. Every sector was green led by consumer discretionary XLY 0.00%↑.
Treasuries were mixed. The 2-year and 10-year T-Notes each fell. The 2-year dropped 1.13% to finish with a yield of 4.45%. The 10-year lost 0.17% and ended with a rate of 4.015%.
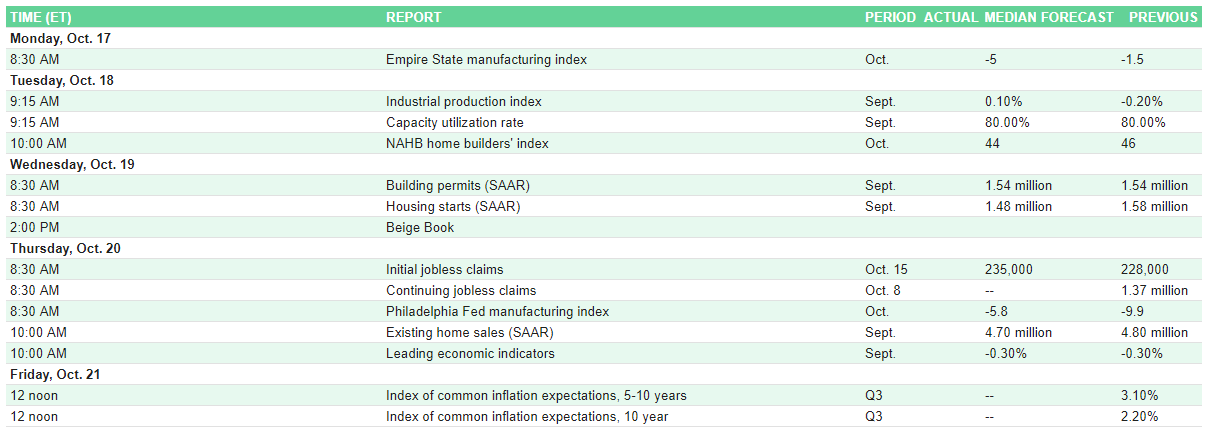
Events this week:
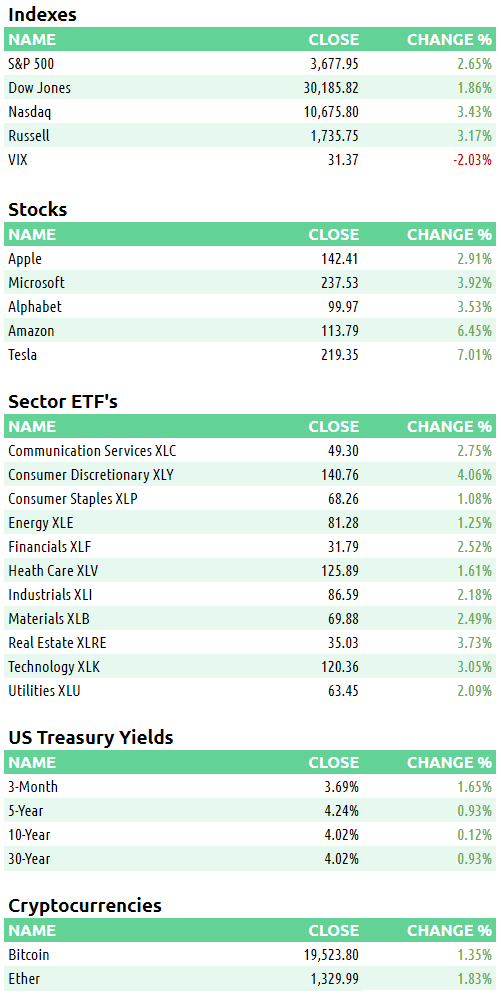
Here are some of today’s closing prices.
E-mini S&P 500 Top-Down Analysis

Below are the monthly (5-years), weekly (2-years) and daily (6-months) charts for ES.

M/M: ES is OTFD as it failed to take out the prior month’s high and has traded and closed below the prior month’s low.
W/W: Today’s fall flipped the week from green back to red. Week over week, ES has a lower high and lower low and continues to trend downwards in the bigger picture. The green from last week couldn’t extend to this one and was a dead cat bounce.
D/D: ES failed to take out the prior day’s high and fell below the prior day’s low by 3-ticks. It is mostly in balance over the past few sessions.
E-mini S&P 500 Metrics
Recent History and Performance

Technicals

E-mini S&P 500 Volume/Market Profile
ES Composite Volume Profile (5 days)
Here is a chart of the past five sessions with a composite ETH Volume Profile:

ES ETH/RTH Split Volume Profile (5 days)
Here is a chart of the past five sessions with a daily ETH/RTH split Volume Profile:

ES ETH/RTH Split Market/Volume Profile (today)
Profile Description: P-shaped. There was a lack of supply as buyers moved the market up. Trapped bids underneath acted as support.
Here’s a TPO chart of today’s session with ETH/RTH split Market/Volume Profile:

ES Market/Volume Profile Levels

RTH Weak High/Low: 3702.50 (high)
RTH Single Prints: n/a
RTH Excess: 3661.50 to 3668.25
RTH Gap: 10/07 gap was still partially filled. Gap is from the prior day’s high at 3725.25 to 3750
Session Recap
Electronic Trading Hours (ETH)
Globex Session:
Wholesale was short at the prior day’s close. The ONO was 1-tick below the prior day’s LOD. Inventory during Globex was 100% long. There was no supply for ES to drop and fill more of the single prints from 10/13/22. Trapped bids kept the market from falling in Globex. Buyers slowly lifted ES throughout Globex. The auction rose above the previous day’s value area and began trading inside the single prints from 10/14/22. Single prints on the way down contain trapped offers so there wasn’t enough demand in Globex to trade higher. Wholesale distributed their inventory over VWAP for much of the ON session and brought the market down some whenever demand diminished. VPOC during Globex was 3639.50.
Range: 71.75
Regular Trading Hours (RTH)
US Session:
The RTH open was above the prior day’s value area but inside the high. It was also inside the T+2 high. There was little supply at the open as buyers quickly lifted the offer and filled the previous day’s single prints in A-period. At 3702.50, supply was finally hit. Sellers moved the auction 30-points but failed to get underneath VWAP. At 3668.25, there was a bid and supply shut off so ES rotated back up. ES slowly climbed and failed to eclipse the prior swing high on two separate TPO-periods. Buyers fell 1-tick short for a triple top weak high, an indication or strong overhead supply. From E through O-periods, ES traded in a range from 3681.50 and 3702.25. Wholesale was able to liquidate inventory acquired the previous day at higher prices over VWAP.
Range: 41