
Daily Digest 10/14/2022
Yesterday's rally is stalled as markets reverse. The 10-year T-Note closes above 4%.

Market Overview

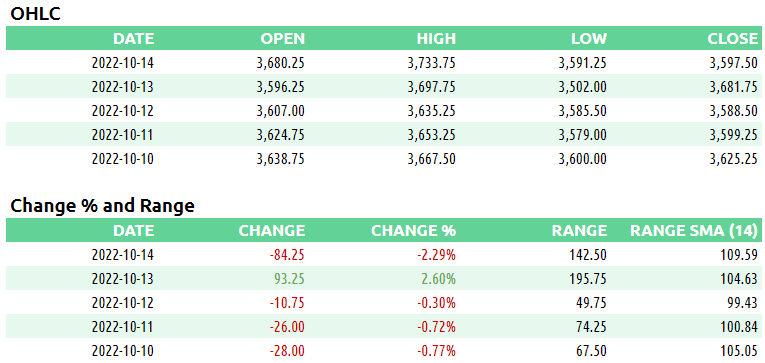
Every index fell today as yesterday’s rally couldn’t continue. The Dow was the only index to finish the week in the green. Every S&P sector ended down today, with consumer discretionary XLY 0.00%↑ and energy XLE 0.00%↑ falling the most. First Republic Bank FRC 0.00%↑ had the worst day among S&P constituents, while US Bancorp USB 0.00%↑ led the winners.
Treasuries continued to rise. The 2-year T-Note closed 1 basis point shy of 4.5%. This level was last seen in August of 2007. The 10-year Treasury closed above 4%. The 10-year can be viewed as a proxy for mortgage rates. When it rises, mortgage rates rise too. In addition, yields have an inverse relationship to bonds. So as yields rise, bonds fall. This is bad for investors in bonds, such as retirees.
JP Morgan’s Jamie Dimon provides additional warnings regarding the state of the markets.
Michigan Consumer Sentiment rose more than expected, but inflation fears persist.
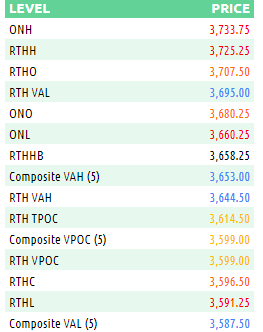
Here are some of today’s closing prices.

E-mini S&P 500 Top-Down Analysis

Below are the monthly (5-years), weekly (2-years) and daily (6-months) charts for ES.
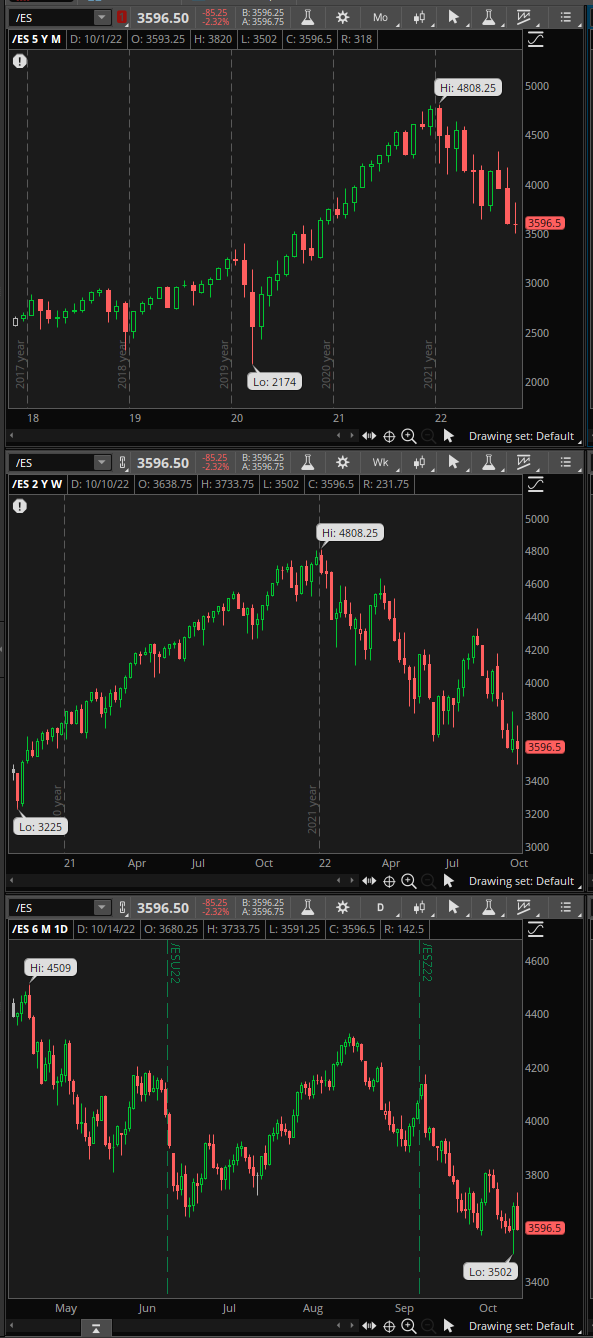
M/M: ES is OTFD as it failed to take out the prior month’s high and has traded and closed below the prior month’s low.
W/W: Today’s fall flipped the week from green back to red. Week over week, ES has a lower high and lower low and continues to trend downwards in the bigger picture. The green from last week couldn’t extend to this one and was a dead cat bounce.
D/D: ES violently whipsawed back and forth the last two sessions as it took out the prior day’s high but failed to erase the low. There’s now a higher high and higher low. ES is beginning to put in a significant amount of time in the 3600-3750 range.
E-mini S&P 500 Metrics
Recent History and Performance
Technicals

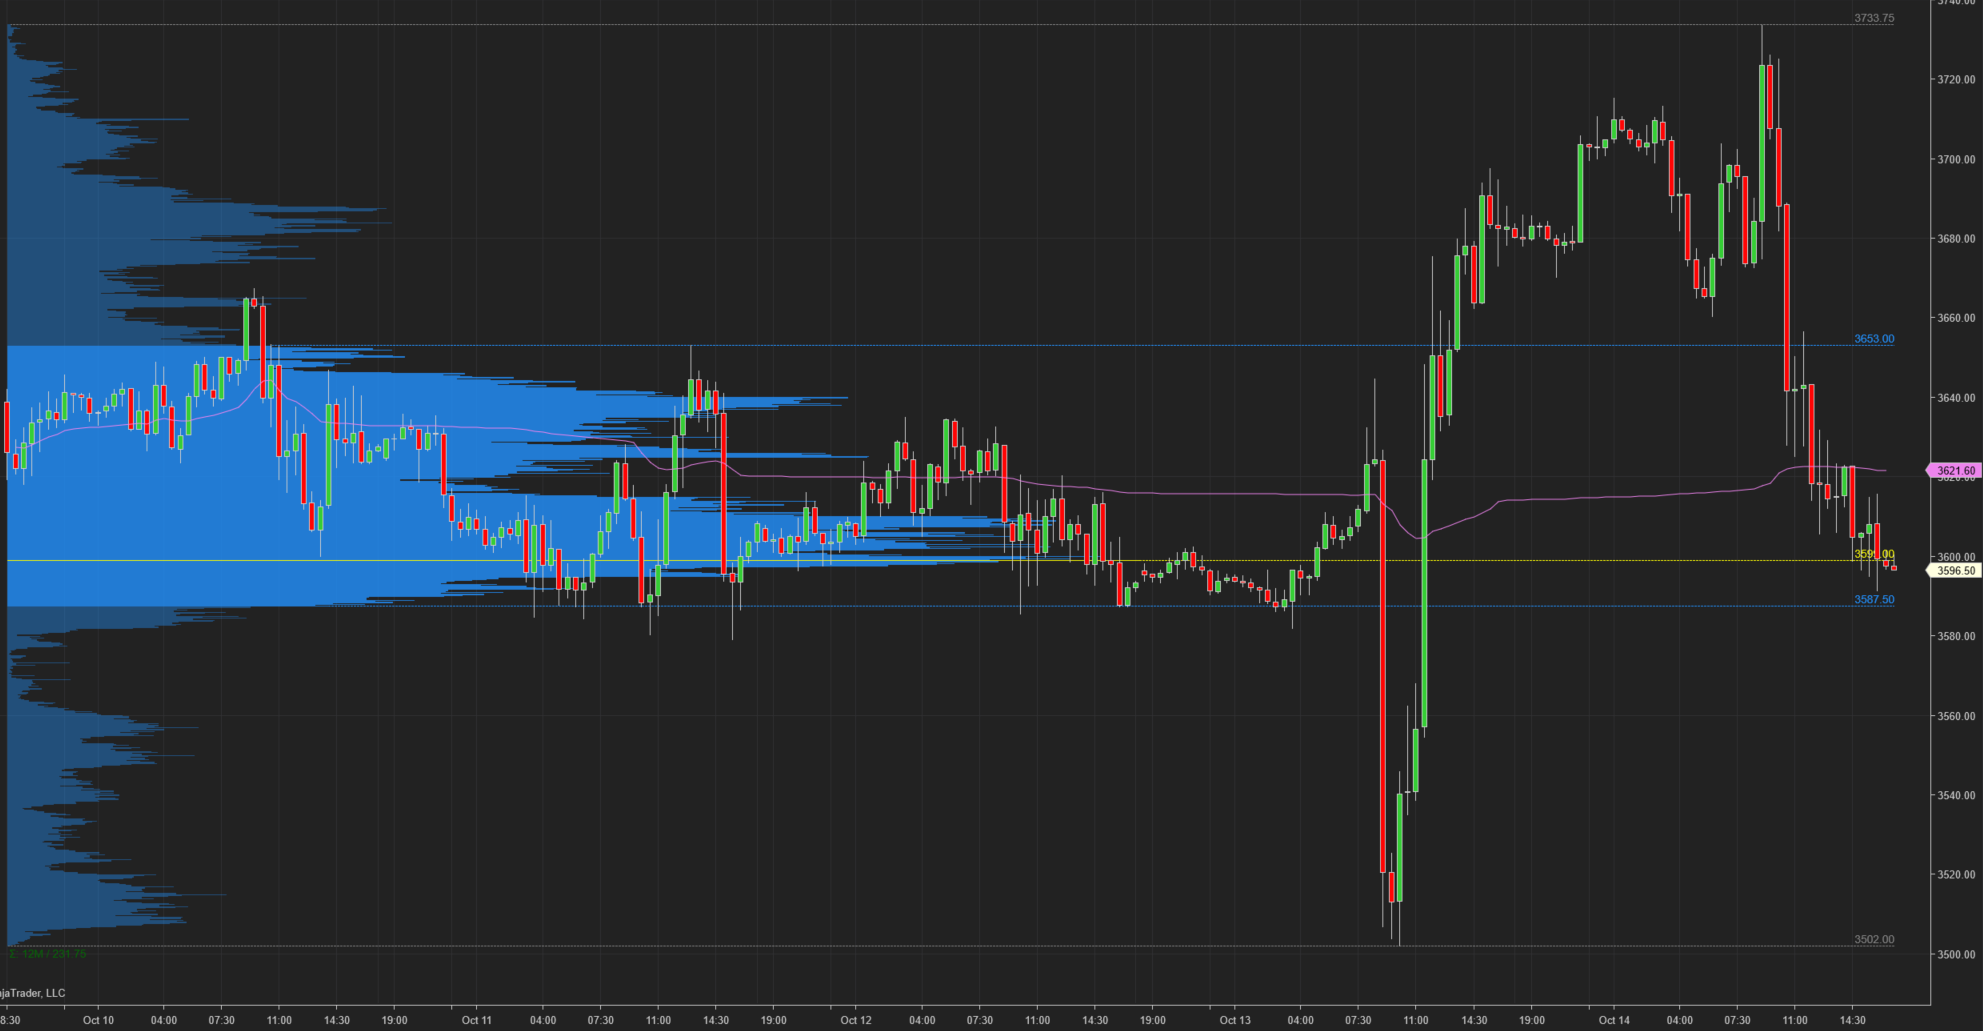
E-mini S&P 500 Volume/Market Profile
ES Composite Volume Profile (5 days)
Here is a chart of the past five sessions with a composite ETH Volume Profile:
ES ETH/RTH Split Volume Profile (5 days)
Here is a chart of the past five sessions with a daily ETH/RTH split Volume Profile:

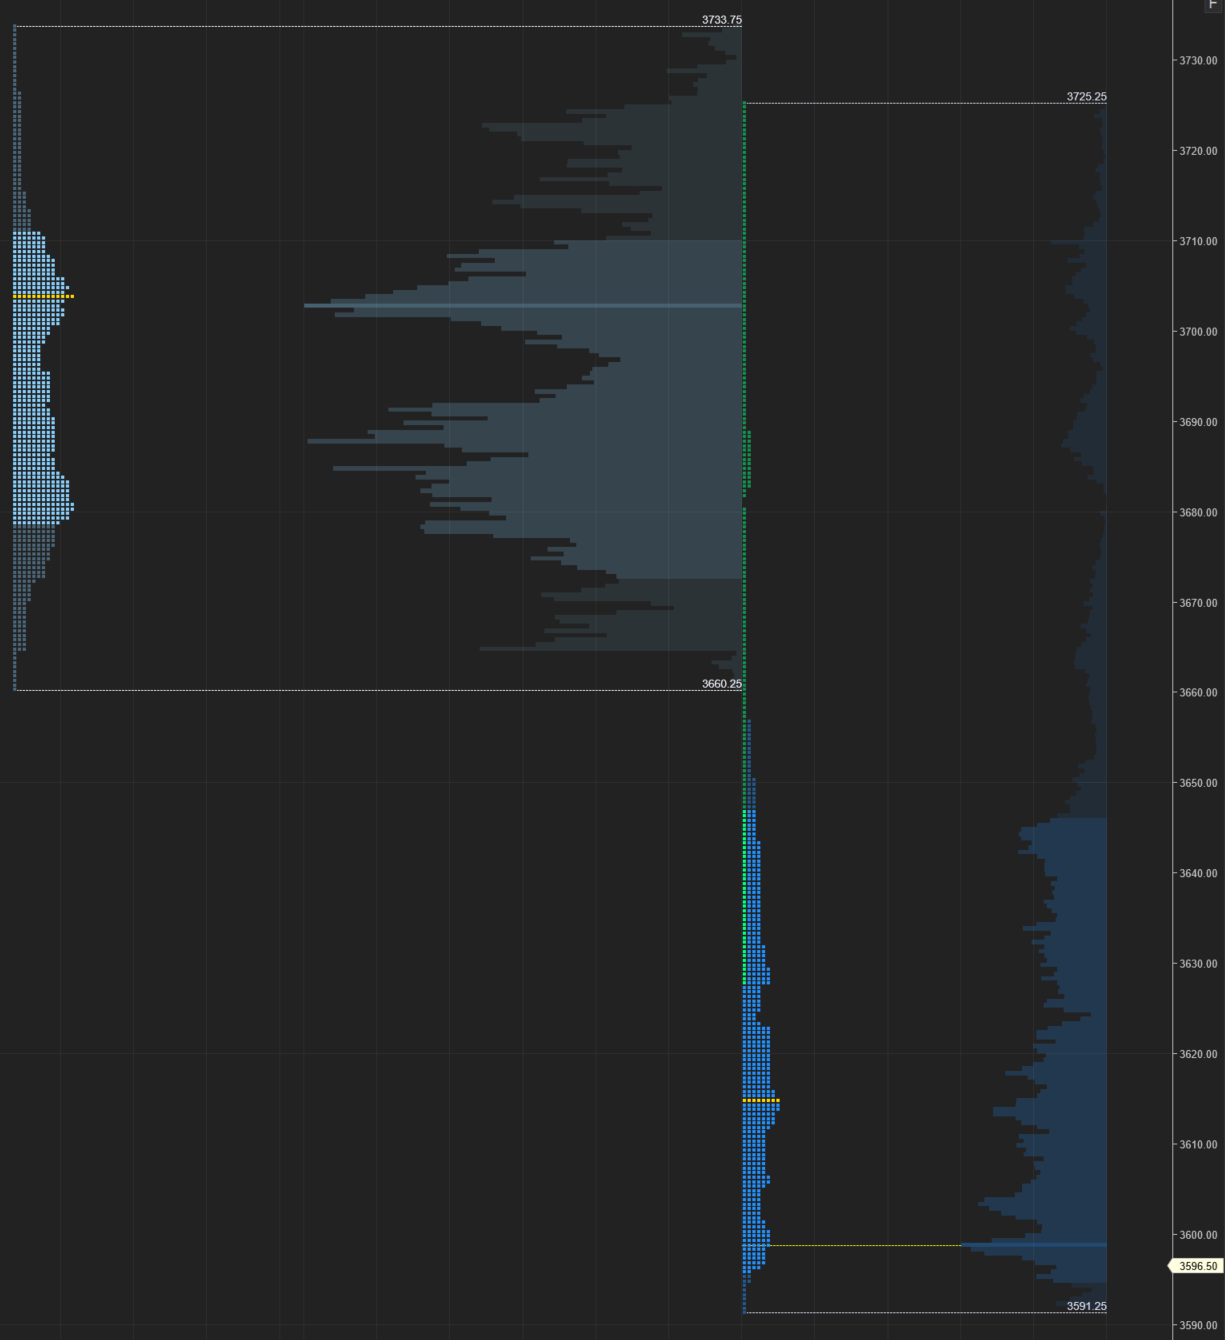
ES ETH/RTH Split Market/Volume Profile (today)
Profile Description: Today had some volume at the top of the profile but the bigger HVN was at the bottom of the profile.
Here’s a TPO chart of today’s session with ETH/RTH split Market/Volume Profile:
ES Market/Volume Profile Levels
RTH Weak High/Low: n/a
RTH Single Prints: 3656.75 to 3681.75
RTH Excess: 3591.25 to 3595; 3689 to 3725.25
RTH Gap: no trades from 3680.75 to 3681.75; 10/07 gap was partially filled. Gap is now from today’s high at 3725.25 to 3750
Session Recap
Electronic Trading Hours (ETH)
Globex Session:
Wholesale was long at the prior day’s close. The ONO was inside of the prior day’s value area. Globex inventory was mostly long, about 75%. The Asian session began flat then found some buyers. They bid the auction over the prior day’s HOD. At 3715.50, the auction stalled and failed to get into the 10/07 ON gap. Supply pushed ES back into the previous day’s range but supply shut off at 3660.25. ES ping-ponged back and forth in a 40-point range before buyers stepped in at 3674.75. Longs lifted the auction above the earlier swing high. The 10/07 gap was partially filled but buyers lost steam at 3733.75 and the market reversed. The Globex VPOC was 3665.25. The auction was bid below 3660 and there was overhead supply from the 10/07 gap.
Range: 73.50
Regular Trading Hours (RTH)
US Session:
The RTH open gapped up and was above the prior day’s high and T+2 high. At the open, buyers lifted the offer and tried to chew away at the 10/07 gap. However, they failed to eclipse the ONH and ran into a wall of supply at 3725.25. The auction reversed and filled the ON gap as supply pushed the auction beneath the ONL. ES fell 100-handles in the next hour. At 3625, supply found a bid momentarily. When the buying ended, the auction dropped again and landed at 3605.50, cutting into the previous day’s single prints. Shorts began to cover and ES traded in a range for the next couple of TPO periods. In J-period, sellers took out the prior swing low. Supply was able to absorb some responsive buyers while continuing to make new session lows. ES bottomed on the day at 3591.25 before buyers stepped in to stabilize the auction. The rally from the previous day, which left single prints, trapped shorts whose bid stabilized today’s auction. Overhead supply from the 10/07 gap prevented further advance to the upside.
Range: 134