
Daily Digest 10/13/2022
What a day. CPI continued to accelerate M/M and Y/Y. Equity futures faltered then risk assets staged a massive reversal. The S&P went from being down 2.39% to close at plus 2.60%.

Market Overview


The S&P 500 sank to new 52-week lows, 3491.58, its lowest level since November 6, 2020. Every index staged an epic rally, with the S&P bouncing as much as 5.44% off the low, or 189-points. Every sector was green led by financials XLF 0.00%↑. The S&P’s losing streak ended at six sessions. It was the 5th largest intraday reversal for the S&P 500. It was the 4th largest for the Nasdaq.
US Treasuries and the dollar all rose after the CPI print. They all lost steam since. Longer duration Treasuries fell the most but remained green while the Dollar index flipped negative. The 2-year T-Note was as high as 4.535% but ended around 4.47%. The 10-year reached a high of 4.08% but finished the day at 3.958%.
Bitcoin got as low as 18,131 before rising as high as 19,509.23
CPI rose 0.4% M/M and 8.2% Y/Y, higher than expected. Core CPI which strips out volatile food and energy costs rose 0.6% M/M and 6.6% M/M, also higher than anticipated. The markets were anticipating another Fed rate hike of 75 bps in November and 50 bps in December. The chances are increasing that the Fed goes with back-to-back 75 bps hikes to finish the year.
Is now the time to invest in semiconductors? Liz Young says it might be near.
Fidelity analyzes some of the challenges that a strong US dollar poses.
Here are some of today’s closing prices.

E-mini S&P 500 Top-Down Analysis

Below are the monthly (5-years), weekly (2-years) and daily (6-months) charts for ES.

M/M: ES is OTFD as it failed to take out the prior month’s high and has traded and closed below the prior month’s low.
W/W: After trading beneath the low of the previous week, ES has now flipped green for the current week.
D/D: OTFD ended today in dramatic fashion. Following yesterday’s inside day, ES had an outside day of massive proportions. ES traded beyond the highs and lows of the current week.
E-mini S&P 500 Metrics
Recent History and Performance
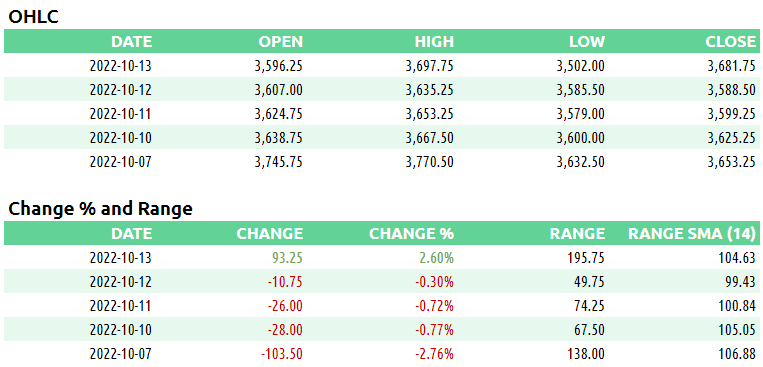
Technicals

E-mini S&P 500 Volume/Market Profile
ES Composite Volume Profile (5 days)
Here is a chart of the past five sessions with a composite ETH Volume Profile:

ES ETH/RTH Split Volume Profile (5 days)
Here is a chart of the past five sessions with a daily ETH/RTH split Volume Profile:

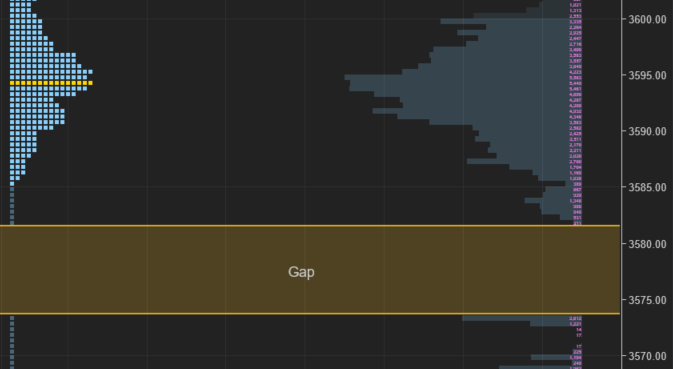
ES ETH/RTH Split Market/Volume Profile (today)
Profile Description: Today’s profile was long with several high volume areas on the top and bottom.
Here’s a TPO chart of today’s session with ETH/RTH split Market/Volume Profile:
ES Market/Volume Profile Levels
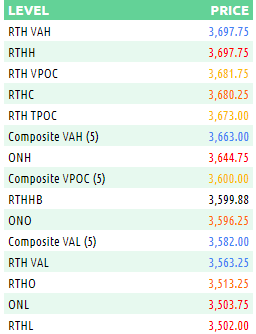
RTH Weak High/Low: n/a
RTH Single Prints: 3568.25 to 3619.25
RTH Excess: 3502 to 3535; 3695 to 3697.75
RTH Gap: ON gap was filled but the 10/07/22 gap still exists.
Session Recap
Electronic Trading Hours (ETH)
Globex Session:
Wholesale was short at the prior day’s close. The ONO was below the previous day’s value area but above the LOD. Inventory during Globex was long, roughly 80% of the time. For the first few hours, ES rotated around VWAP and a range from 3590.25 through 3602.50. Leading up to the London open, sellers moved ES below this zone. When London opened, shorts tried to continue selling but ON supply shut off at 3581.75, below the prior day’s LOD. Buyers lifted ES over VWAP and back into the previous day’s range and value area. Longs continued to lift ES over the previous day’s value area high and HOD. ES reached 3632.50 before finding supply again. The 5-day VPOC was 3600 during this time. Large traders were taking inventory acquired and distributing it higher ahead of CPI. When the CPI figure was released, ES fell 140-points from 3644.75 down to 3503.75, a new 2022 intraday low. The VPOC at the end of Globex was 3515. Two observations in the sharp move down below.

Range: 141.00
Regular Trading Hours (RTH)
US Session:
The RTH open gapped down and was underneath the prior day’s LOD and T+2 low. At the open, ES sold down and took out the ONL by 7-ticks. At 3502, supply shut off and ES had a major bounce. Buyers lifted ES on a huge rally, OTFU from A through E-periods. The uptrend filled the gaps left from the CPI reaction to get back into the prior day’s range. ES continued climbing above the prior day’s HOD and the ONH. At 3675.50, buyers finally hit supply and began to backfill demand. After balancing for two TPO periods, buyers took out the supply at 3675.50 and ES continued to rise. The auction reached 3697.75 and was unable to absorb the supply there. ES fell slightly on the backfill before closing RTH at xxxx. From just before the release of the September CPI figure to the end of RTH, ES round-tripped 338.50-points. Trapped shorts were being squeezed hard. The 3502 intraday low was near the long-term 50% retracement that was highlighted here before
Range: 195.75