
Daily Digest 10/12/2022
S&P had worst daily close since November 2020. PPI data for September showed inflation is still too hot.

Market Overview
Equity investors were filled with uncertainty around what tomorrow’s CPI number could reveal about the economy and the Fed’s potential actions. As a result every index fell slightly with an inside day, where today’s high and low was inside the previous day’s high and low. The S&P’s losing streak extended to six sessions, the second time it’s held a streak of this length in the past 30-days. The index also set a new closing low for the year and it’s lowest close since November 20, 2020. Three sectors were able to remain green with energy XLE 0.00%↑ leading the way. Utilities XLU 0.00%↑ performed the worst.
Treasury yields fell for the second straight day. The 3-month T-Bill was the exception again as it rose 17 bps, hitting 3.6% at one point intraday. The 2-year lost 0.44%, falling to 4.29%. The 10-year lost 1.29% and fell to 3.90%.
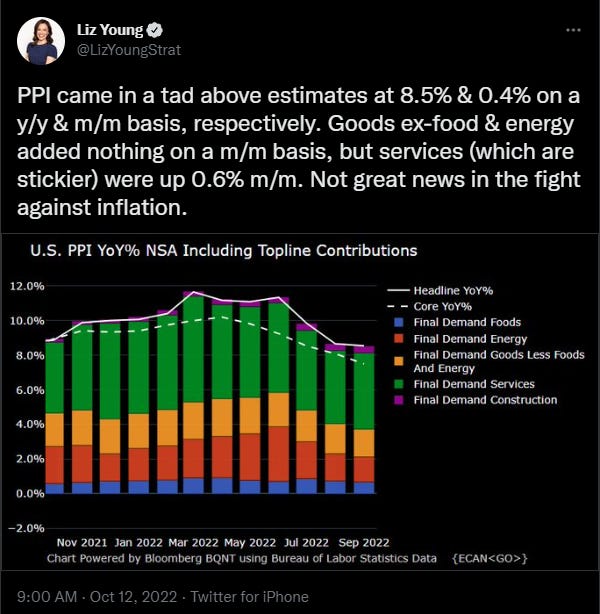
Producer Price Index (PPI) figures revealed that wholesale prices rose 8.5% Y/Y and 0.4% M/M in September, higher than what was anticipated. PPI measures what producers, or businesses receive for goods and services that they resell. The CPI number, what consumers pay, will be out tomorrow morning at 8:30am. September inflation figures are expected to show a 0.2% rise and an 8.1% jump in prices over the last 12-months. Below is a table with the CPI figures for the past year along with the S&P’s performance on the day of release.

Katie Stockton has some very informative technical insight on the S&P 500. Some of the levels that she mentions are nearly identical to the ones I highlighted here.
Here are some of today’s closing prices.

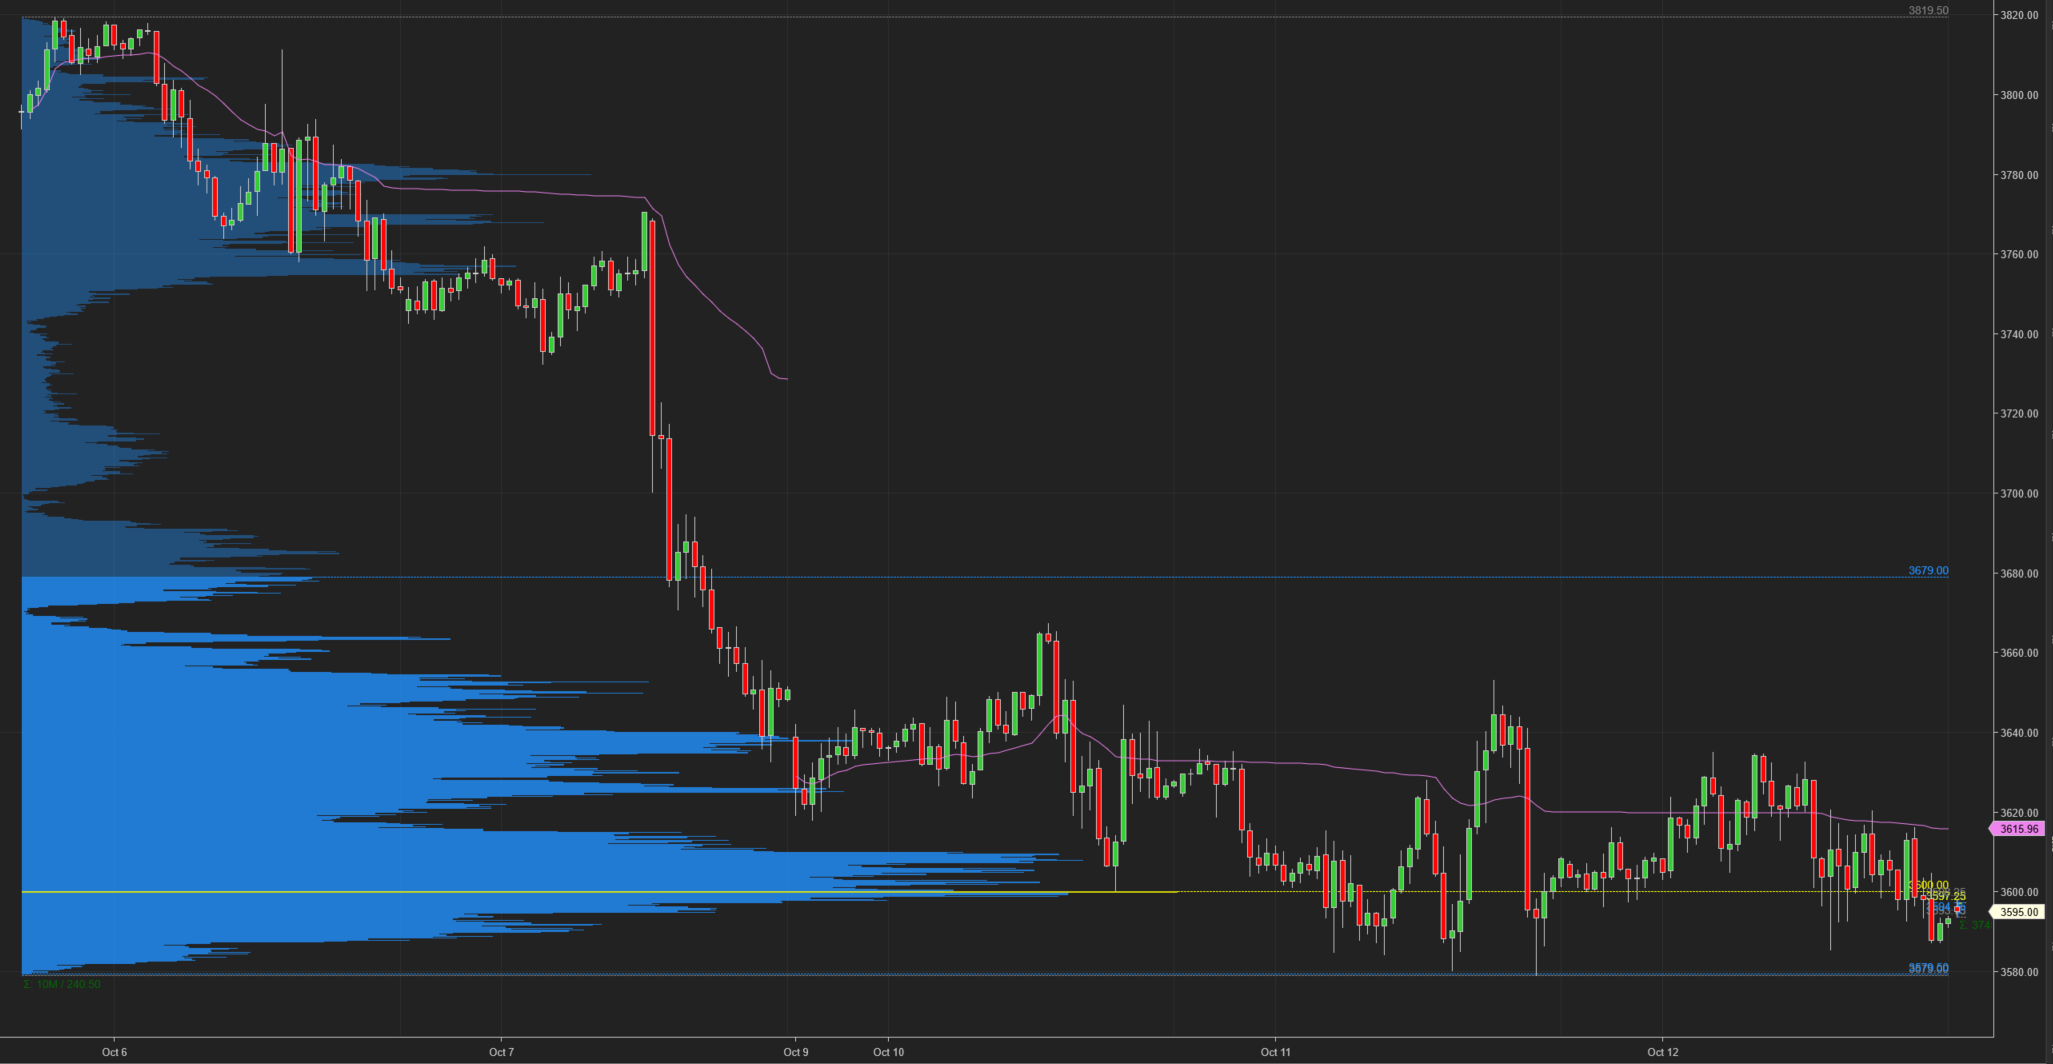
E-mini S&P 500 Top-Down Analysis

Below are the monthly (5-years), weekly (2-years) and daily (6-months) charts for ES.

M/M: ES is OTFD as it failed to take out the prior month’s high and has traded and closed below the prior month’s low.
W/W: ES has formed an outside week this week as price action has gone beyond both the high and low of the prior week. After a strong start to the week, ES finished dropping 170-points off the high.
D/D: For the fifth straight day, ES failed to erase the prior day’s high. ES continues to OTFD. Today was also an inside day with all price action contained inside the prior day’s range.
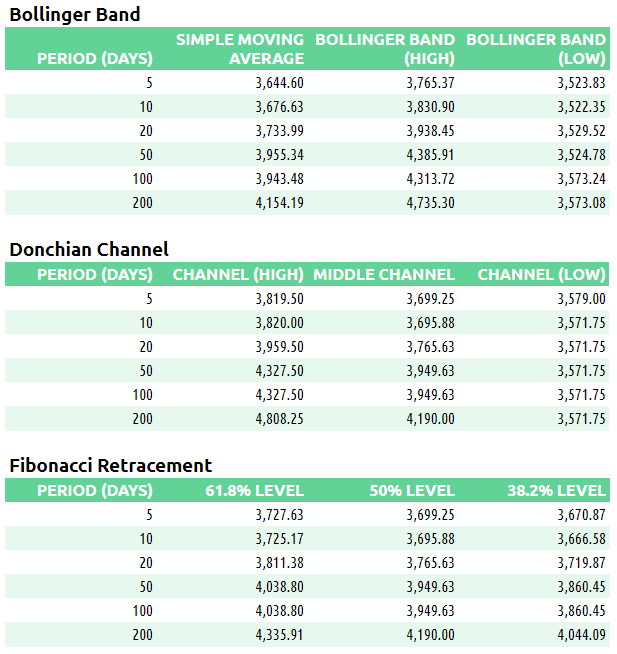
E-mini S&P 500 Metrics
Recent History and Performance

Technicals
E-mini S&P 500 Volume/Market Profile
ES Composite Volume Profile (5 days)
Here is a chart of the past five sessions with a composite ETH Volume Profile:
ES ETH/RTH Split Volume Profile (5 days)
Here is a chart of the past five sessions with a daily ETH/RTH split Volume Profile:

ES ETH/RTH Split Market/Volume Profile (today)
Profile Description: D-shaped profile with HVN concentrated in the center of the profile.
Here’s a TPO chart of today’s session with ETH/RTH split Market/Volume Profile:

ES Market/Volume Profile Levels

RTH Weak High/Low: 3620.75 (high)
RTH Single Prints: n/a
RTH Excess: 3585.50 to 3587.25
RTH Gap: None but 10/07/22 gap still exists.
Session Recap
Electronic Trading Hours (ETH)
Globex Session:
Wholesale was short at the prior day’s close. The ONO was inside of the prior day’s value area. Inventory during Globex was mostly long (70%). Sellers tried to move the market lower during the Asian open but ON supply shut off at 3596.25. The auction slowly rotated up above VWAP and eventually the prior day’s VAH. Buyers ran into a wall of offers at 3635.25 and couldn’t trade above. When London opened, inventory corrected down towards the prior day’s value area. There was a bid underneath VWAP and at 3605, the correction reversed to the upside. A retest of the session’s high failed by 2-ticks as buyers couldn’t lift the offer beyond 3634.75, an indication of strong overhead supply. The 5-day composite VPOC was 3638, so ES failed to trade above. Leading into the 8:30am PPI data release, inventory corrected down to VWAP again but failed to accept. When the PPI figures came out, ES fell 30-handles from 3628. Sellers failed to bring the auction below the ONL. A weak low was put in at 3596.25, an indication of a bid underneath and supply shutting off. VPOC during Globex was 3622. The ON profile was D-shaped and all price action was contained inside the prior day’s RTH range.
Range: 39
Regular Trading Hours (RTH)
US Session:
The RTH open was inside of the prior day’s value area and above the T+2 low. The opening hour was choppy. ES traded back and forth in a 35-point range. Sellers took out the ON weak low and pushed the auction underneath the ON range. However, it lacked the supply to take out the bid to accept lower. Buyers countered and lifted the offer over VWAP. Demand was absorbed by supply one standard deviation above VWAP and could not get above the prior day’s VAH. From B through E-periods, ES ranged back and forth between 3592.50 and 3617.25. During F-period, longs took ES above this range but couldn’t lift the offer above 3620.75, creating a weak high for RTH. ES returned to the intraday balance zone and traded inside of it from G through L-period. Sellers broke down below the balance area in M-period, but ran out of supply a few points shy of the session low. At 3587.25, shorts covered to stabilize ES into the close. It was a rotational, inside day in a small range with CPI tomorrow. There was overhead supply along with trapped bids underneath. Many investors probably sat on the sidelines.
Range: 35.25