
Daily Digest 10/11/2022
Indexes were mixed amid uncertainty. S&P falls for fifth straight session ahead of PPI and CPI data.

Market Overview

There’s plenty of uncertainty ahead of tomorrow’s PPI and Thursday’s CPI figures for September. The markets were mixed. The S&P and Nasdaq fell while the Dow and Russell were up. The $VIX has been rising steadily since hitting 28.50 last week. The S&P is down 5.33% since last Tuesday’s close and had its second worst close of 2022 this afternoon. Three S&P sectors were green today with real estate XLRE 0.00%↑ leading the way. Communications XLC 0.00%↑ dropped the most. Health care company, Viatris VTRS 0.00%↑ was the best individual stock while Las Vegas Sands Corp LVS 0.00%↑ fared the worst.
Most Treasuries fell on the day. The 2-year T-Note lost 1.7 bps. The 10-year hit above 4% intraday but ended the day down 1 basis point. The 3-month T-Bill was the only riser, gaining 2.12%.
The IMF released a report where they cut their global growth forecast for next year and warn that ‘the worst is yet to come.’
Here are some of today’s closing prices.

E-mini S&P 500 Top-Down Analysis

Below are the monthly (5-years), weekly (2-years) and daily (6-months) charts for ES.

M/M: ES is OTFD as it failed to take out the prior month’s high and has traded and closed below the prior month’s low.
W/W: ES has formed an outside week this week as price action has gone beyond both the high and low of the prior week. After a strong start to the week, ES finished dropping 170-points off the high.
D/D: For the fourth straight day, ES failed to erase the prior day’s high. ES continues to OTFD.
E-mini S&P 500 Metrics
Recent History and Performance

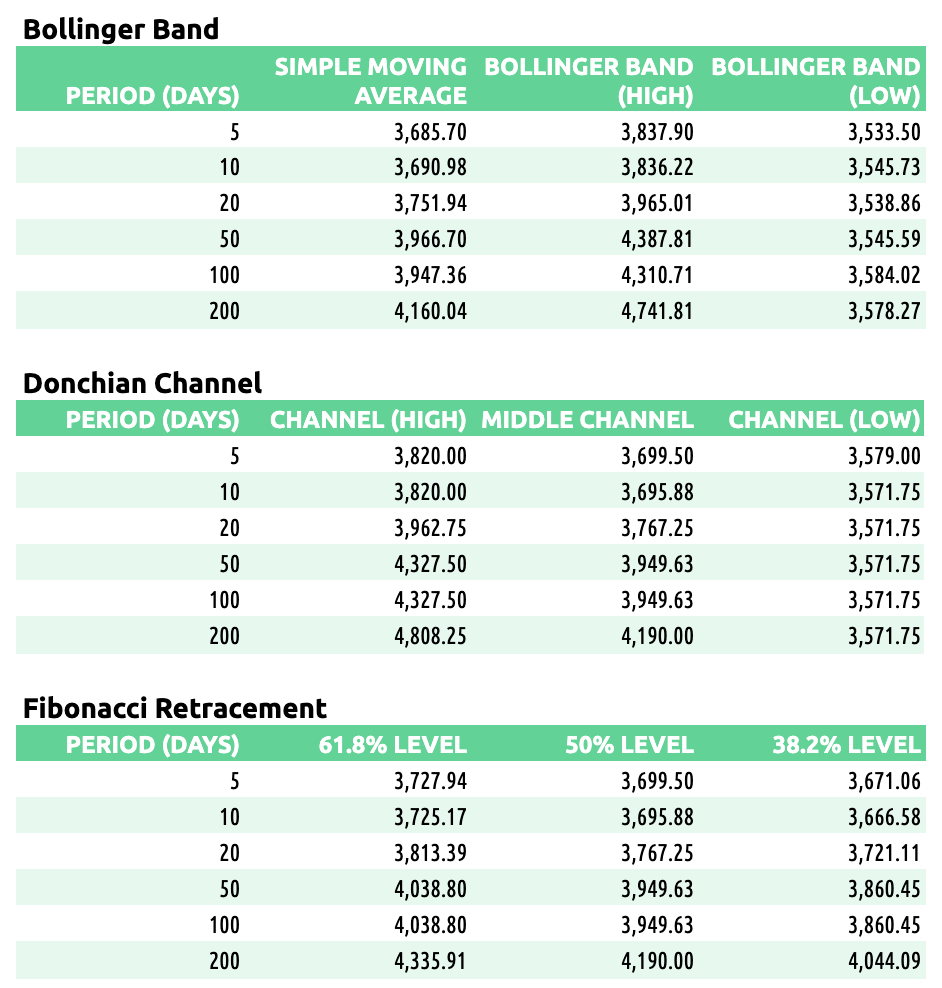
Technicals
E-mini S&P 500 Volume/Market Profile
ES Composite Volume Profile (5 days)
Here is a chart of the past five sessions with a composite ETH Volume Profile:

ES ETH/RTH Split Volume Profile (5 days)
Here is a chart of the past five sessions with a daily ETH/RTH split Volume Profile:

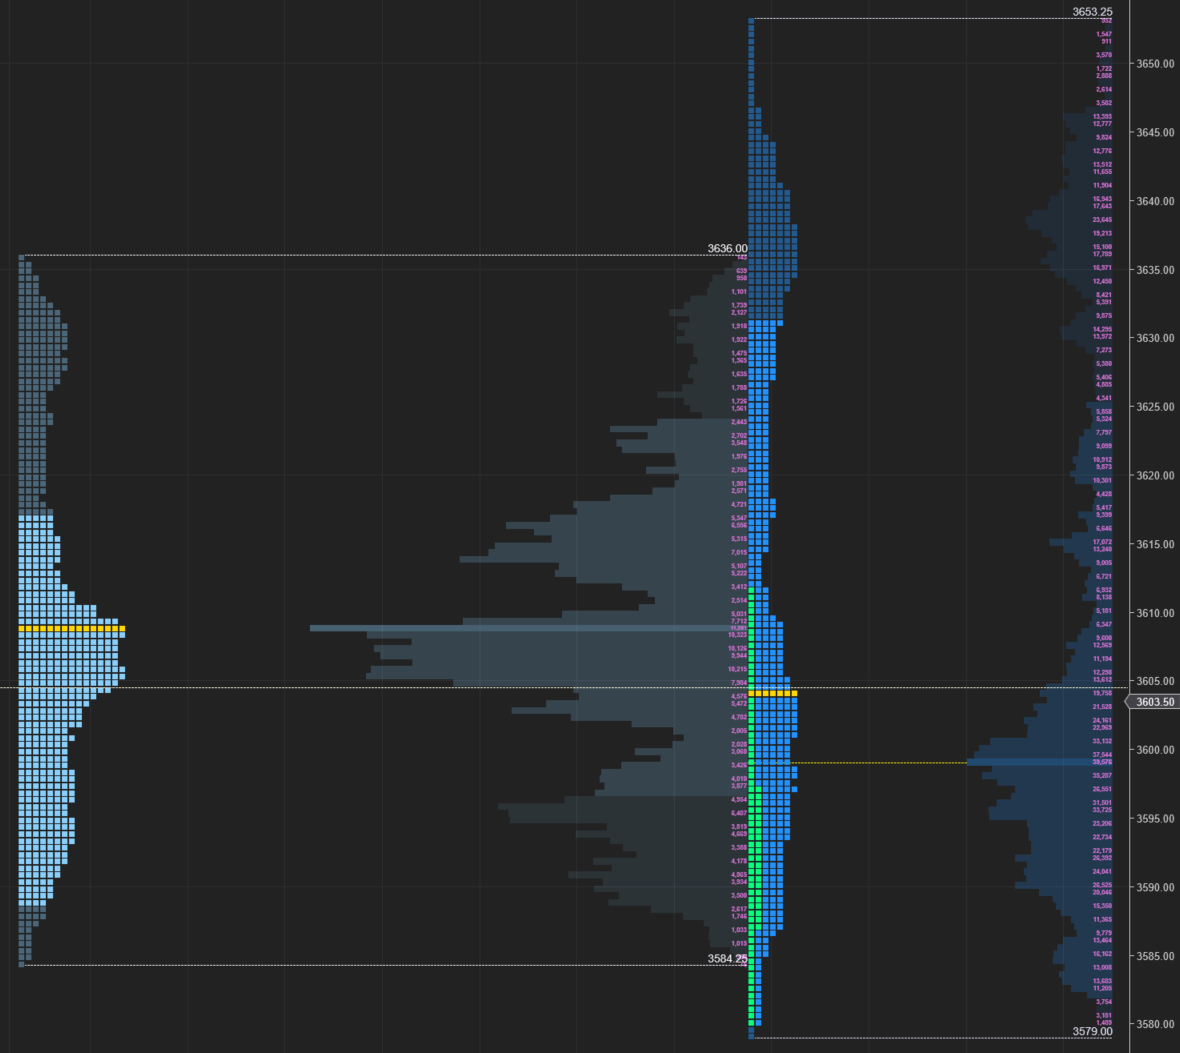
ES ETH/RTH Split Market/Volume Profile (today)
Profile Description: B-shaped profile with two larger distributions at the top and bottom of the profile.
Here’s a TPO chart of today’s session with ETH/RTH split Market/Volume Profile:
ES Market/Volume Profile Levels

RTH Weak High/Low: n/a
RTH Single Prints: n/a
RTH Excess: 3579 to 3580.25; 3646.75 to 3653.25
RTH Gap: None but 10/07/22 gap still exists.
Session Recap
Electronic Trading Hours (ETH)
Globex Session:
Wholesale was short at the prior day’s close. The ONO was inside of the prior day’s value area. Inventory during Globex was mostly short. When Asia opened, buyers tried to lift the offer. However, they failed to raise ES above 3636. After several TPO periods, supply pushed ES underneath VWAP and the prior day’s value area. ES caught a bid at 3601 momentarily. When London opened up, there was some back and forth volatility. Eventually supply crushed demand and ES fell beneath the prior day’s LOD. At 3584.75, buyers stepped in and stabilized ES resulting in a 30-point rally. When the buying ended, ES fell further and ran out of supply at 3584.25. Buyers brought ES back into the prior day’s value area. At 3628.25, buyers weakened as more supply was hit and ES fell just before the start of the NY open. ON VPOC was 3608.75.
Range: 51.75
Regular Trading Hours (RTH)
US Session:
The RTH Open was inside the prior day’s price range and below the T+2 low. At the open, buyers attempted to bid ES up but lost steam at 3611.50. Supply absorbed the bid and from there ES fell 31-handles, beneath the ONL. At 3580.25, supply shut off and buyers lifted the offer. From C through G-period, ES couldn’t erase the prior period’s low and was OTFU. ES bounced 70-points from the low. ES got above the prior day’s VAH and at 3653.25, the buying faded. The auction traded sideways in a 15-point channel for 2-3 TPO periods. In K-period, supply hit and ES fell 50-points to get beneath the prior day’s low again. ES fell another 20-handles in L-period for a new LOD at 3579. Supply ran out here and shorts covered to stabilize ES.
Range: 74.25