
Daily Digest 10/07/2022
Payrolls grow by 263k in September. The S&P falls for the third straight session after a strong start to the week.

Market Overview

Risk assets ended the week on a sour note. Every index fell after the BLS released non-farm payroll data for the month of September. The Nasdaq fell the most. Every S&P sector was negative. Energy XLE 0.00%↑ once again led the way only falling 0.78%. AMD AMD 0.00%↑ had the largest drop while DexCom DXCM 0.00%↑ had the largest gain.
The 2-year T-Note got back over 4.3%. The 5-year reached 4.14%. The 10-year Treasury got back to 3.9% before falling slightly.
Non-farm payrolls grew last month by 263k, less than the 275k estimate. This wasn’t enough to ease investors as the selloff signals belief that the Fed will continue hiking interest rates to combat inflation.
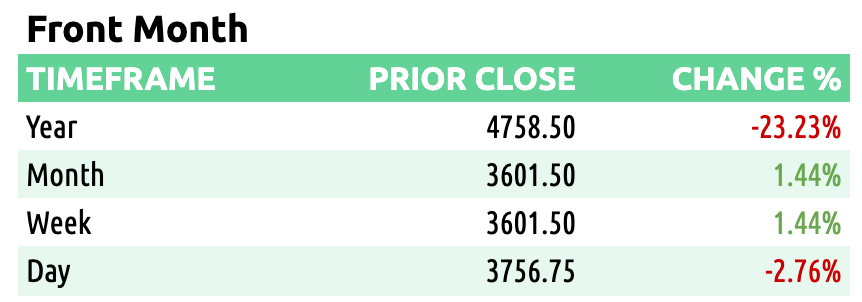
Here are some of today’s closing prices.

E-mini S&P 500 Top-Down Analysis
Below are the monthly (5-years), weekly (2-years) and daily (6-months) charts for ES.
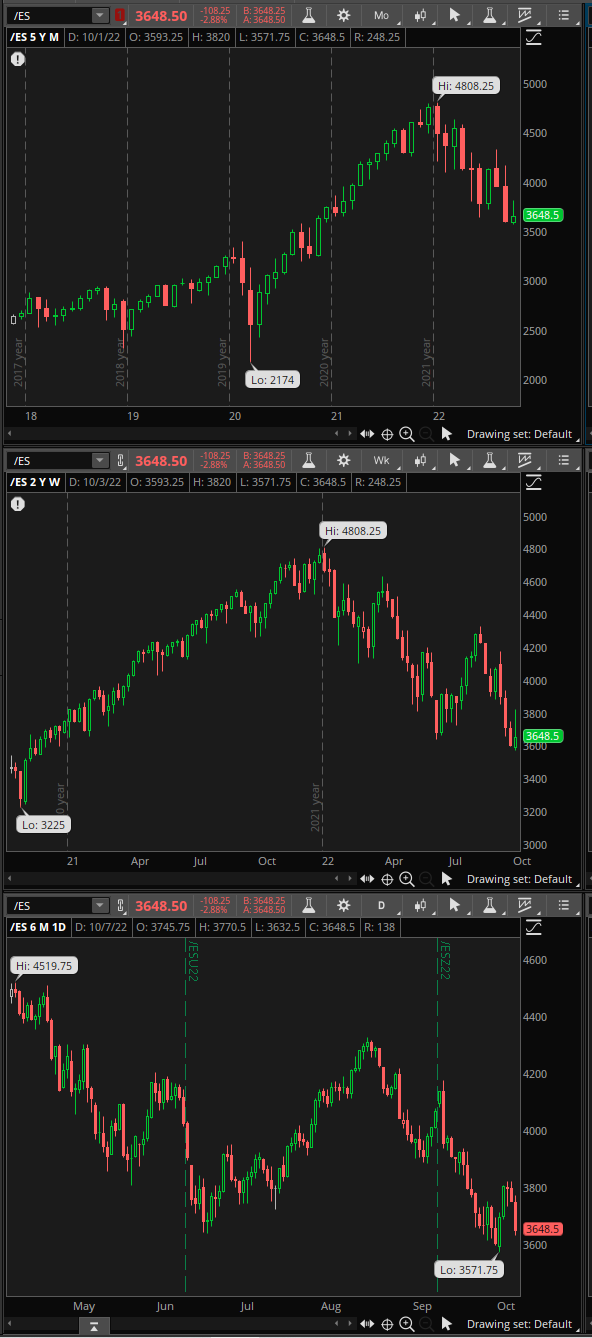
M/M: ES is OTFD as it failed to take out the prior month’s high and has traded and closed below the prior month’s low.
W/W: ES has formed an outside week this week as price action has gone beyond both the high and low of the prior week. After a strong start to the week, ES finished dropping 170-points off the high.
D/D: ES broke down below the two-day balance area. It failed to erase the prior day’s high for the 2nd straight session. ES is OTFD.
E-mini S&P 500 Metrics
Recent History and Performance

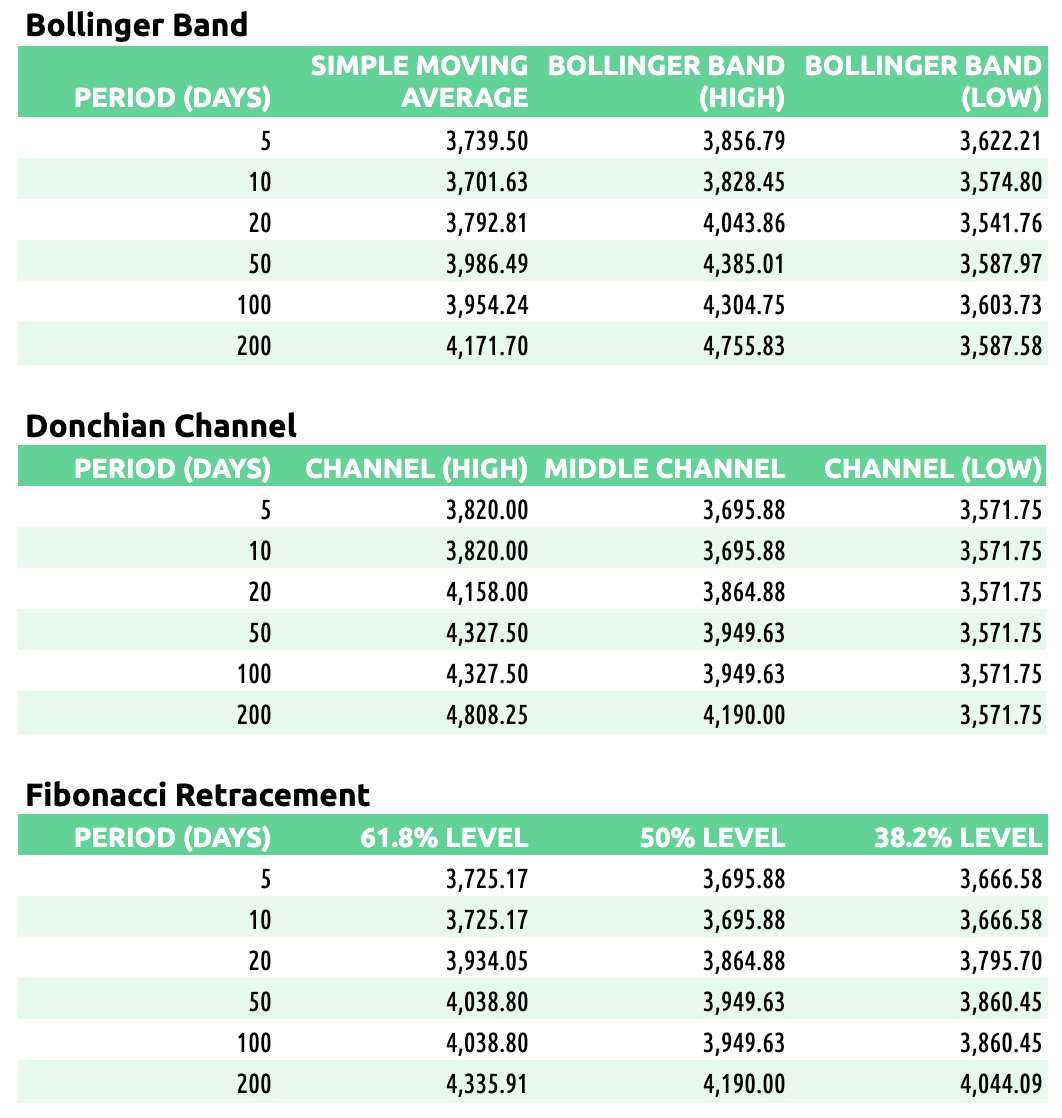
Technicals
E-mini S&P 500 Volume/Market Profile
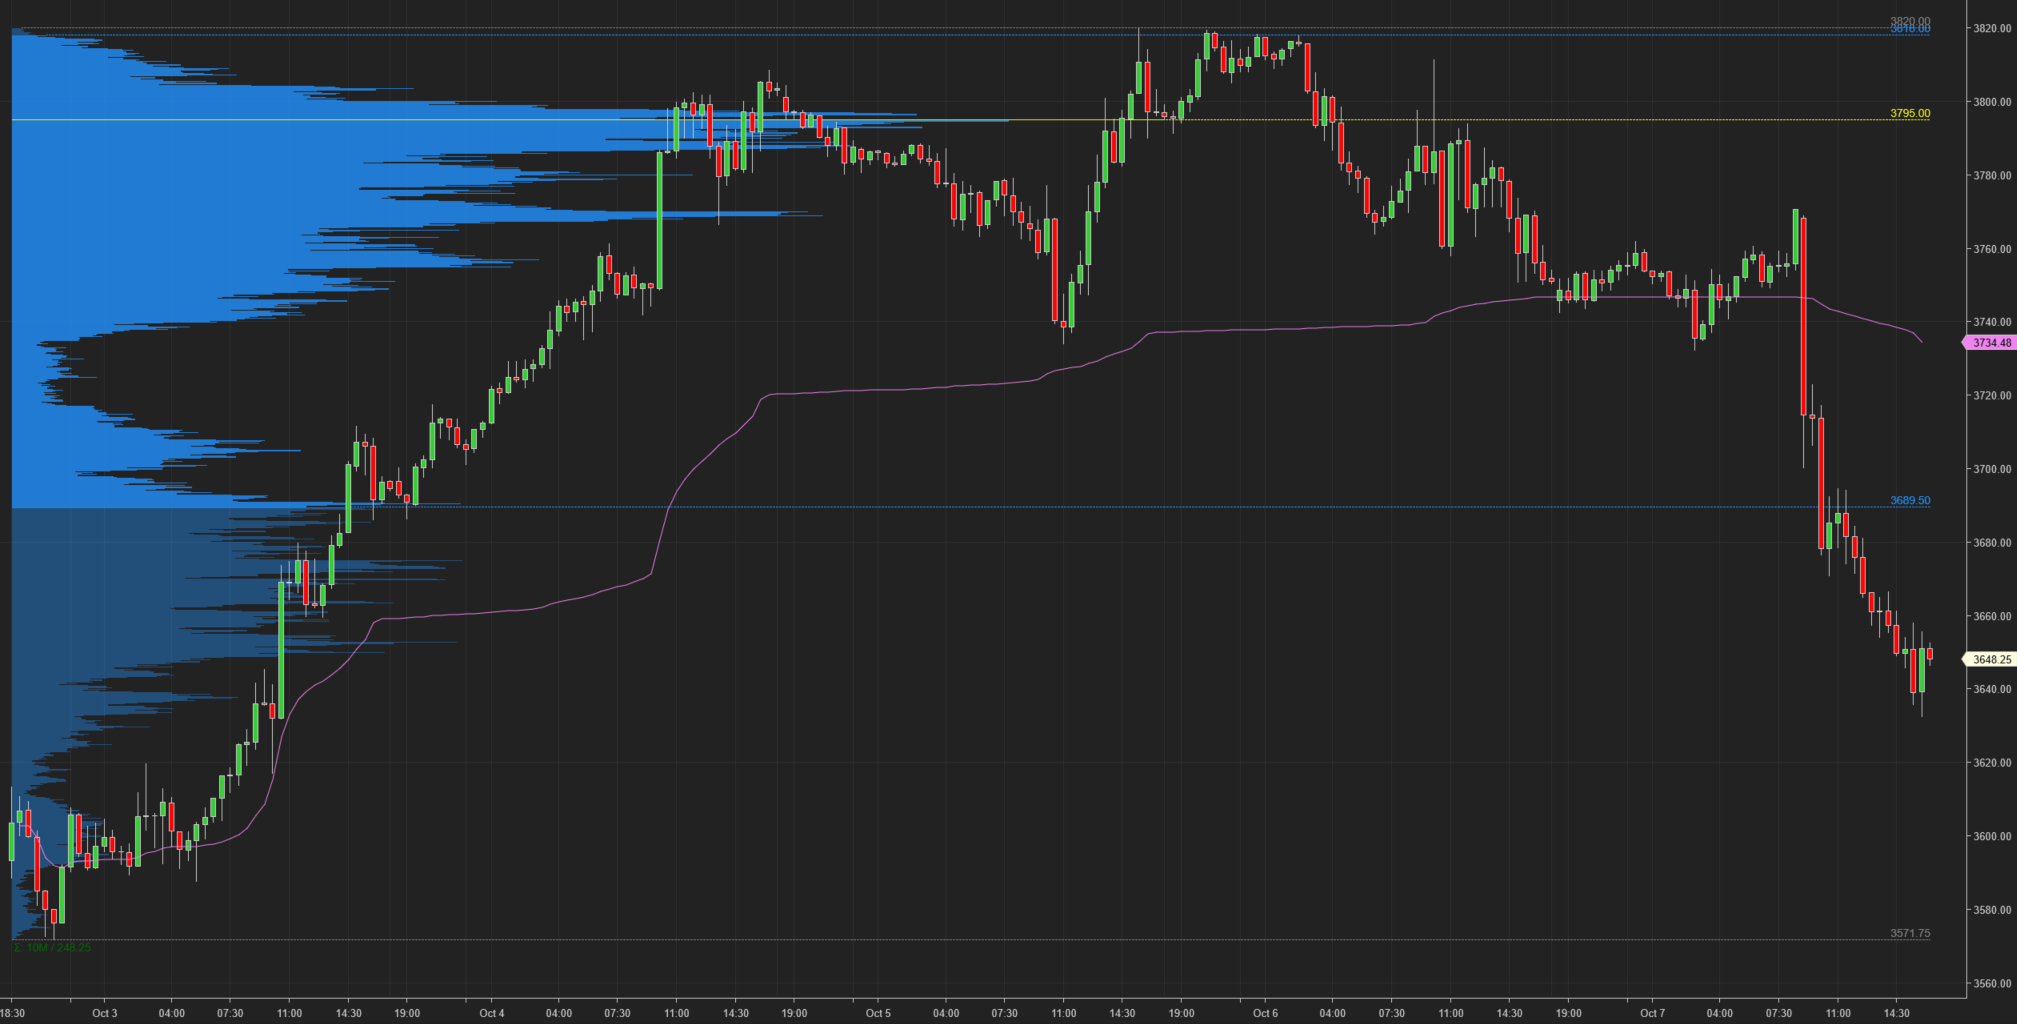
ES Composite Volume Profile (5 days)
Here is a chart of the past five sessions with a composite ETH Volume Profile:
ES ETH/RTH Split Volume Profile (5 days)
Here is a chart of the past five sessions with a daily ETH/RTH split Volume Profile:

ES ETH/RTH Split Market/Volume Profile (today)
Profile Description: The profile had two high volume nodes (HVN). The top HVN was from 3672.75 to 3691.50. The lower HVN was from 3646.75 to 3664.50.
Here’s a TPO chart of today’s session with ETH/RTH split Market/Volume Profile:
ES Market/Volume Profile Levels

RTH Weak High/Low: n/a
RTH Single Prints: 3666.75 to 3670.75
RTH Excess: 3632.50 to 3635.75; 3694.75 to 3717.50
RTH Gap: 3717.50 to 3750
Session Recap
Electronic Trading Hours (ETH)
Globex Session:
Wholesale was short at the prior day’s close. The ONO was beneath the prior day’s LOD, repairing the weak low, 3750, in RTH. ES was rotating during Globex, however it was mostly short (about 75%). ES rose to get back into the prior day’s range and value area but buyers met supply at 3762. ES rotated underneath VWAP and the prior day’s LOD. Supply shut off at 3732.25. ES began steadily to rise and approach the prior session high before stalling. Once the BLS non-farm payrolls figure was released at 8:30am, ES shut up to erase the prior session high and then reversed. The auction fell 60-handles immediately on the news, filling the Oct 4th ON gap. At 3700.25, sellers found the bid and things stabilized from there. There were single prints from 3723 to 3732.25. The VPOC was around 3755. The sharp move down trapped some offers.
Range: 70.25
Regular Trading Hours (RTH)
US Session:
The RTH open gapped down and was beneath the prior day’s LOD and T+2 low. There were no buyers at the open as ES could barely fill to gap or the ON single prints. ES fell 40-points and got under the ONL. At 3670.75, supply ran into a bid. ES traded sideways in a 25-point range from B through E period. During F period, sellers broke down beneath the range and OTFD to 3654 for the next 3 TPO periods. Some buyers were found at this level but supply eventually absorbed their bids and pushed ES lower. ES fell to 3632.50 before short covering stabilized the fall. This came within 3-ticks of the B period low from Monday (10/4) in which buyers pushed ES north 40-handles. Shorts were trapped during that move and their bids need to be absorbed for ES to fall further.
Range: 85