
Daily Digest 10/06/2022
The markets were stuck in neutral as investors await tomorrow's jobs report. Initial jobless claims rose to 219k last week.

Market Overview

The markets stalled today as all four major indices were negative. Every S&P sector fell except for Energy XLE 0.00%↑, which gained 1.7% (Crude oil rose 0.79%). Carnival Corp CCL 0.00%↑ fared the worst for individual names while Dexcom DXCM 0.00%↑ led the winners.
The 3-month T-Bill fell 1 basis point. Meanwhile, the 2-year, 5-year, 10-year, 20-year and 30-year Treasury yields all rose. The 2-year closed at 4.26%. The 10-year T-Note was at 3.83%.
Initial jobless claims in the US rose to their highest level since August. The 219k from last week was higher than the anticipated 203k. A recent report showed that US based companies sliced nearly 30k jobs last month, a 68% increase Y/Y and 46% M/M. The BLS will release nonfarm payroll numbers tomorrow for last month.
Research from Fidelity explains why the strong US dollar could be more of a headwind to Q3 earnings season than analysts are expecting.
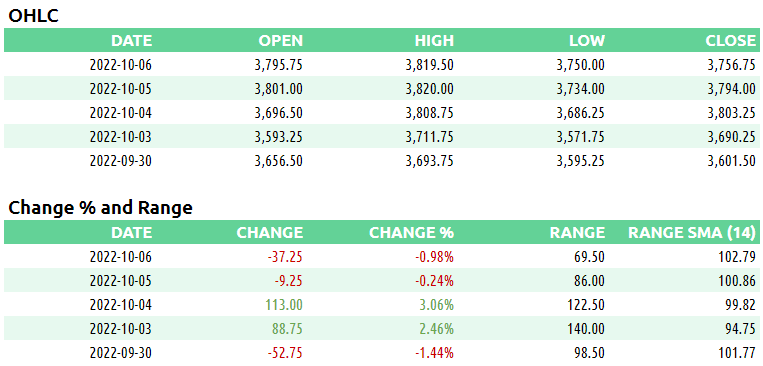
Here are some of today’s closing prices.

E-mini S&P 500 Top-Down Analysis

Below are the monthly (5-years), weekly (2-years) and daily (6-months) charts for ES.
M/M: ES is OTFD as it failed to take out the prior month’s high and has traded and closed below the prior month’s low.
W/W: ES has formed an outside week this week as price action has gone beyond both the high and low of the prior week.
D/D: Today was an inside day as ES failed to take out the high and low from the prior day. ES is in balance.
E-mini S&P 500 Metrics
Recent History and Performance
Technicals

E-mini S&P 500 Volume/Market Profile
ES Composite Volume Profile (5 days)
Here is a chart of the past five sessions with a composite ETH Volume Profile:

ES ETH/RTH Split Volume Profile (5 days)
Here is a chart of the past five sessions with a daily ETH/RTH split Volume Profile:

ES ETH/RTH Split Market/Volume Profile (today)
Profile Description: Today’s profile was somewhat b-shaped with plenty of excess above the lower distribution.
Here’s a TPO chart of today’s session with ETH/RTH split Market/Volume Profile:

ES Market/Volume Profile Levels

RTH Single Prints: n/a
RTH Excess: 3794 to 3811.50
RTH Gap: n/a
Session Recap
Electronic Trading Hours (ETH)
Globex Session:
Wholesale was slightly short at the prior day’s close. The ONO was inside of the prior day’s value area. Inventory during Globex was about 55% short. It began the Asian open going long as buyers lifted the ask. ES rose over the prior day’s VAH but buyers lost steam at 3819.50, two ticks from the prior day’s HOD. A weak high was put in at this level indicating supply was able to absorb the buyers. Heading into the London open, ES corrected downwards to get back into the prior day’s value area and under VWAP. From the high, ES fell 56-handles but remained inside the prior day’s value area. ON supply shut off at 3763.75. Shorts were trapped from the previous day’s afternoon rally. New and trapped shorts covered on the bid to halt the decline. ES corrected towards VWAP but failed. VPOC in Globex was 3794.75.
Range: 55.75
Regular Trading Hours (RTH)
US Session:
The RTH open was inside the prior day’s value area and inside the T+2 high and low. The US open began with a massive stop run. ES rose 30-handles at the open before reversing course. The auction then proceeded to fall 25-points for a 85 to 90-point round trip. ES got beneath the ONL and at 3758, supply ran out. Buyers lifted the market up on lack of supply. However at 3794, buyers lost steam. ES fell to 3763.25 during E and F period. ES traded back and forth in a 20 to 25-point channel for the next couple TPO periods. During K-period, ES broke down and took out the prior session low. ES hit 3750.75 and put in a weak low in K and L period. After some short covering fueled a 20-point bounce, ES fell again. A new weak low was created at 3750 during N and O periods, indicating trapped shorts underneath. ES ended the day at 3751.
Range: 61.50