
Daily Digest 10/04/2022
Stocks surge again as the S&P 500 posts its best 2-day gain since 2020. The BLS reports that job openings fell 10% in August. Treasuries slide again.

Market Overview

They say October is the bear market killer. So far it’s holding up to that name. Equities surge for the second straight day. Is this merely a dead cat bounce? We’ll have to wait and see. But according to Susquehanna, the strength of this rally is something that hasn’t been witnessed since 2000. For the third time in the past five trading days, 97% of the index’s components were up. Every index was up more than 2.75% on the day. Every sector was green again. Energy XLE 0.00%↑ led the way for the second straight day on the heels of tomorrow’s OPEC+ meeting. Twitter TWTR 0.00%↑ led the way for S&P symbols on news that Elon Musk was planning to follow through on his commitment to purchase the social media company. Welltower WELL 0.00%↑ was the index’s worst performer. The 2-year Treasury lost 2.1 bps and fell beneath 4% momentarily. The 10-year T-Note was also in the red for a second straight day losing 1.2 bps. According to the Bureau of Labor Statistics’ JOLTS report, job openings fell in August to 10.05 million. It was the biggest monthly drop since April 2020 and a good sign for the Fed. Billionaire Ray Dalio announced today that he’s handing over the reigns to Bridgewater Associates, the company he founded and the world’s largest hedge fund with $150 billion in assets under management (AUM).

Here are some of today’s closing prices.

E-mini S&P 500 Top-Down Analysis

Below are the monthly (5-years), weekly (2-years) and daily (6-months) charts for ES.

M/M: ES is OTFD as it failed to take out the prior month’s high and has traded and closed below the prior month’s low.
W/W: For three consecutive weeks, ES is OTFD. The auction failed to trade above the previous week’s high and has traded beneath the prior week’s lows.
D/D: ES didn’t take out the prior day’s low so it’s now OTFU.
E-mini S&P 500 Metrics
Recent History and Performance

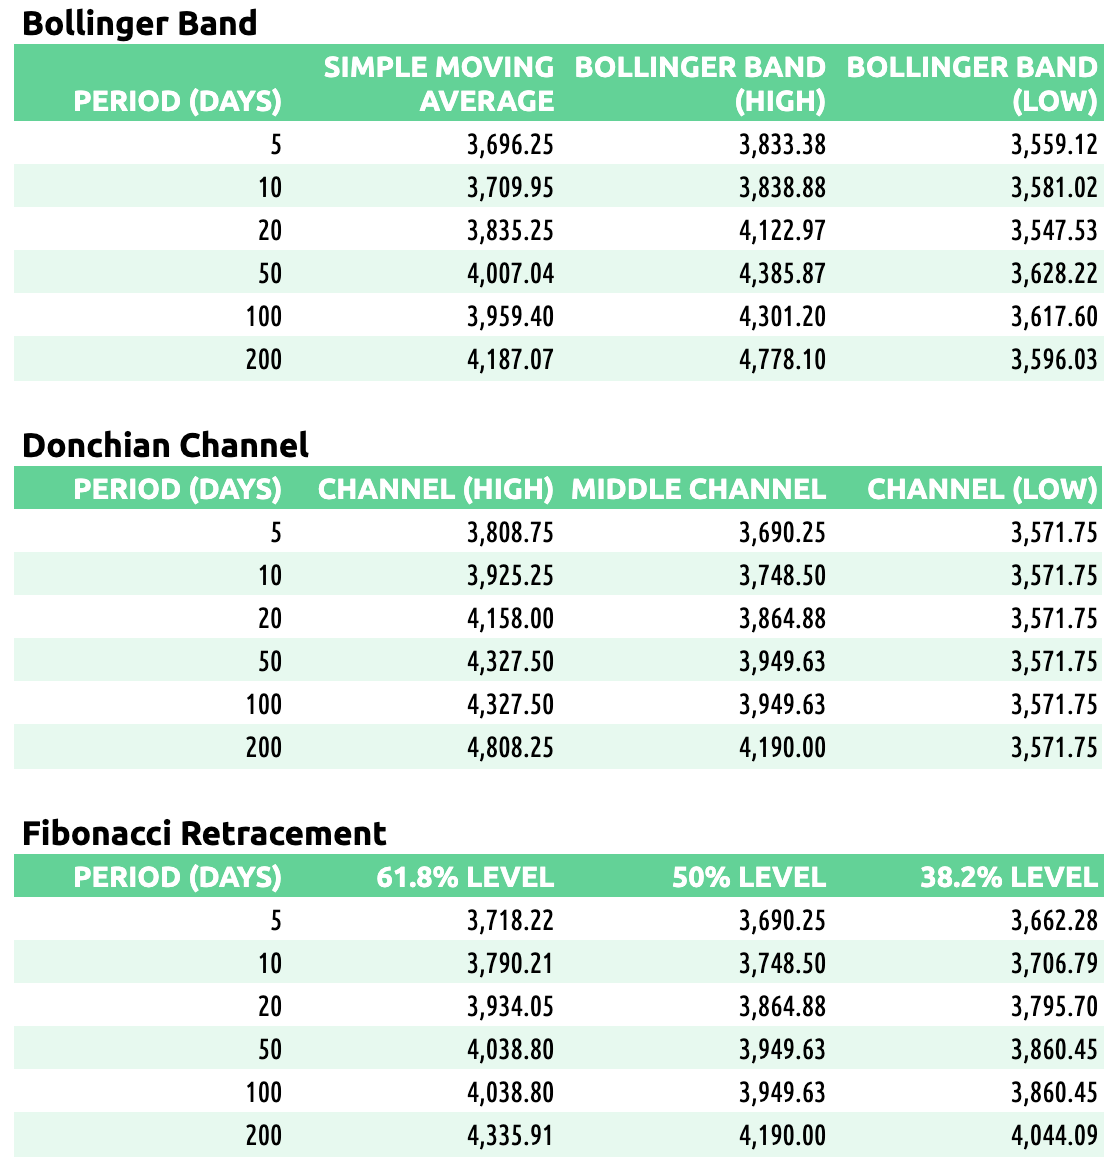
Technicals
E-mini S&P 500 Volume/Market Profile
ES Composite Volume Profile (5 days)
Profile Description: Today’s rally put a HVN above 3787. The larger HVN is in the 3635 to 3670 area.

ES RTH Volume Profile (today)
Profile Description: Today had a P-shaped profile. Shorts were trapped on the move up (potential buyers when revisited).
Here is a chart of the past five sessions with a daily ETH/RTH split Volume Profile:

ES RTH Market Profile (today)
RTH Poor Low/High: n/a
RTH Single Prints: n/a
RTH Excess: 3748.50 to 3789; 3805.75 to 3808.75
Here’s a TPO chart of today’s session with ETH/RTH split Market Profile:

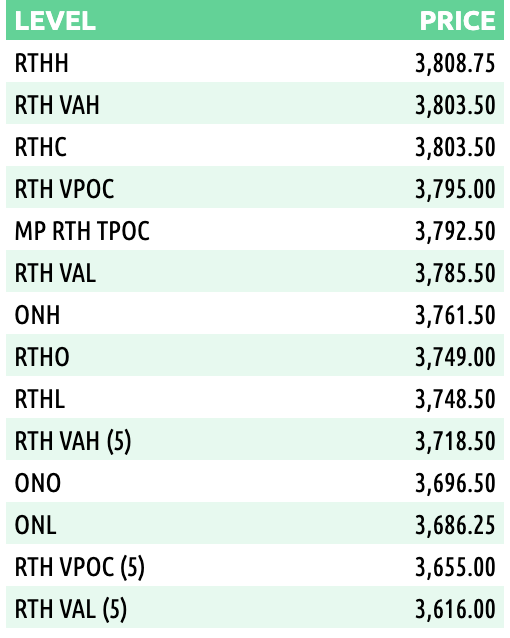
ES Market/Volume Profile Levels
Session Recap
Electronic Trading Hours (ETH)
Globex Session:
At the prior day’s close, wholesale was long. The ONO was inside of the previous day’s value area. Inventory during Globex was 94% long. Sellers tried to sell the auction down but there wasn’t enough ON supply to get underneath 3686.25. ES rotated upwards as wholesale sold into the buyers. The offer kept getting lifted as buyers brought the auction above the prior day’s HOD. ES climbed to 3761.5 where buyers began to wane. The VPOC for the ON session was around 3750. Traders are trapped short still and their bid is supporting ES.
Range: 75.25
Regular Trading Hours (RTH)
US Session:
The RTH open gapped up and was above the prior day’s HOD and was also above the T+2 high. As was the theme in the ON session, there was little supply in the US session. Sellers could only move ES down 2-ticks before ES reversed to the upside. ES rose 50-handles in the first hour of trading. The rally began to slow down around 3800. It crept on higher and hit 3802.50. However, from late morning through early afternoon, ES traded mostly sideways from the swing high down to 3784.50. During H-period, this level broke down as wholesalers lowered their offers in search of demand. ES fell beneath VWAP momentarily, touching 3766.50. There was a lack of supply and follow-through as ES bounced off this level. The responsive buyers took ES up to 3800.25, a couple of points shy of the session high. Supply absorbed the buyers here and ES fell 20-points to 3780.50. Unable to go any lower, buyers absorbed the offer and lifted ES to new session highs in the final half hour of NYSE trading. ES touched 3808.75 before backfilling down again.
Range: 60.25