Daily Digest 10/03/2022
Every index up 2% to begin the month amid falling Treasury yields. Manufacturing activity in September fell but still in expansion mode.
Market Overview
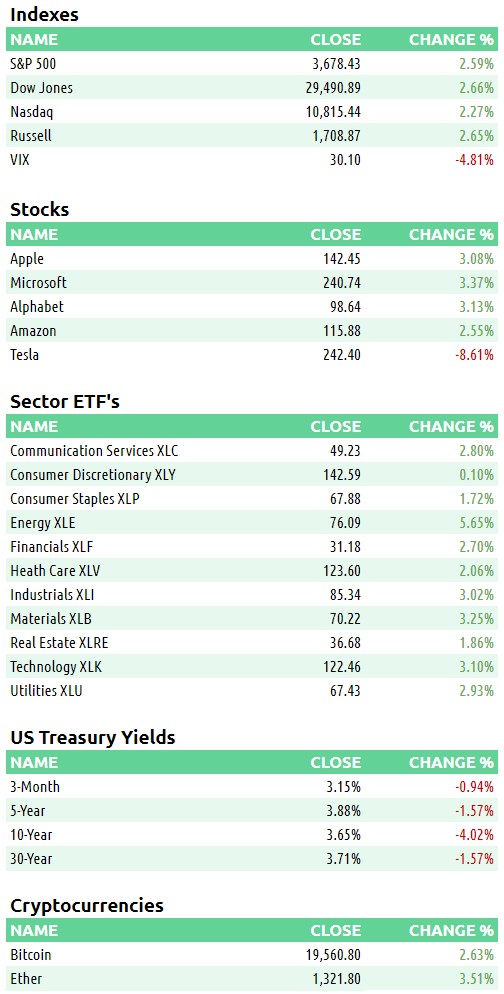
Stocks began the month of October with a bang. Every index and S&P sector was positive. Energy XLE 0.00%↑ led all sectors on reports that OPEC+ may cut oil production by 1 million barrels per day. With individual symbols, Marathon Oil MRO 0.00%↑ was the best ticker. Tesla TSLA 0.00%↑ fell the most on falling production and deliveries. Despite slowing down, manufacturing activity grew at the slowest pace in 2.5 years according to the ISM Manufacturing Index released this morning. Treasury yields dropped; the 2-year fell 3.85% and the 10-year fell 4.96%. The Dollar index fell for the 3rd day out of 4 after hitting the highest level since May 2002.
Events this week:
Here are some of today’s closing prices.
E-mini S&P 500 Top-Down Analysis
Below are the monthly (5-years), weekly (2-years) and daily (6-months) charts for ES.
M/M: ES is OTFD as it failed to take out the prior month’s high and has traded and closed below the prior month’s low.
W/W: For three consecutive weeks, ES is OTFD. The auction failed to trade above the previous week’s high and has traded beneath the prior week’s lows.
D/D: ES had an outside day in which all of the prior day’s price action was inside the current day’s price range (higher high and lower low).
E-mini S&P 500 Metrics
Recent History and Performance
Technicals
E-mini S&P 500 Volume/Market Profile
ES Composite Volume Profile (5 days)
ETH VAH: 3696.50
ETH VPOC: 3650
ETH VAL: 3623.50
Here is a chart of the past five sessions with a composite ETH Volume Profile:
ES RTH Volume Profile (today)
RTH VAH: 3699.75
RTH VPOC: 3669.75
RTH VAL: 3654.75
Here is a chart of the past five sessions with a daily ETH/RTH split Volume Profile:
ES RTH Market Profile (today)
RTH TPOC: 3667
RTH Poor Low/High: n/a
RTH Single Prints: 3641.50 to 3659.50
RTH Excess: 3617 to 3631.75; 3709.50 to 3711.75
Here’s a TPO chart of today’s session with ETH/RTH split Market Profile:
Session Recap
Electronic Trading Hours (ETH)
Globex Session:
Wholesale was short at the prior day’s close. The ONO was inside the prior day’s price range but below the value area. Inventory during Globex rotated from short to long. In total, it was about 55% long. During the Asian open, ES initially failed to get into the prior day’s value area. As a result, the auction rotated down and got beneath the prior day’s LOD. At 3571.75, ON supply was exhausted and ES rotated up and over VWAP. ES traded in a 25-point channel for several TPO periods before buyers consumed the offers to take ES into the previous day’s value area.
ONO: 3593.25
ONH: 3645.50
ONL: 3571.75
Range: 73.75
Regular Trading Hours (RTH)
US Session:
The RTH open was inside the prior day’s value area and inside the T+2 low and high. ES fell after the opening bell but there was a lack of supply to get below the prior day’s value area. At 3617, ES rotated upwards with limited supply and rose above the ONH. Buyers kept on absorbing the offer to raise ES above the prior day’s VAH. At 3680, ES stalled as demand faded. Wholesalers backfilled in search of buyers. ES fell to 3659, before trending higher again as buyers appeared in the order flow and wholesale lifted their offers. ES started OTFU from TPO periods G through K and eclipsed the prior day’s HOD in the process. Buyers couldn’t lift the offer higher than 3711.75 before exhausting in the face of supply. ES fell about 25-points to end the day at 3694.50.
O: 3635.75
H: 3711.75
L: 3617
Range: 94.75


