
Daily Digest 10/10/2022
Markets were open today and the S&P extended its losing streak to four.

Market Overview

Every index fell led by the Nasdaq. After a huge 2-day rally off the 2022 low last week, the S&P 500 is now 0.79% from a retest. Four S&P sectors managed gains today, led by consumer staples XLP 0.00%↑. For individual names, Walgreens Boots Alliance WBA 0.00%↑ gained the most while Wynn Resorts WYNN 0.00%↑ suffered the largest fall.
US Treasuries all rose today. The 2-year T-Note rose 1.1 bps and the 10-year ascended 7.6 bps.
Billionaire hedge fund manager Paul Tudor Jones believes the U.S. economy is either near or already in the middle of a recession. One of the greatest traders of all-time, PTJ also thinks risk assets also have more room to fall.
“Most recessions last about 300 days from the commencement of it,” Jones said. “The stock market is down, say, 10%. The first thing that will happen is short rates will stop going up and start going down before the stock market actually bottoms.”
JPMorgan CEO, Jamie Dimon also chimed in and expects US to enter recession in six to nine months.
Events this week:

Here are some of today’s closing prices.

E-mini S&P 500 Top-Down Analysis

Below are the monthly (5-years), weekly (2-years) and daily (6-months) charts for ES.

M/M: ES is OTFD as it failed to take out the prior month’s high and has traded and closed below the prior month’s low.
W/W: ES has formed an outside week this week as price action has gone beyond both the high and low of the prior week. After a strong start to the week, ES finished dropping 170-points off the high.
D/D: For the third straight day, ES failed to erase the prior day’s high. ES continues to OTFD.
E-mini S&P 500 Metrics
Recent History and Performance

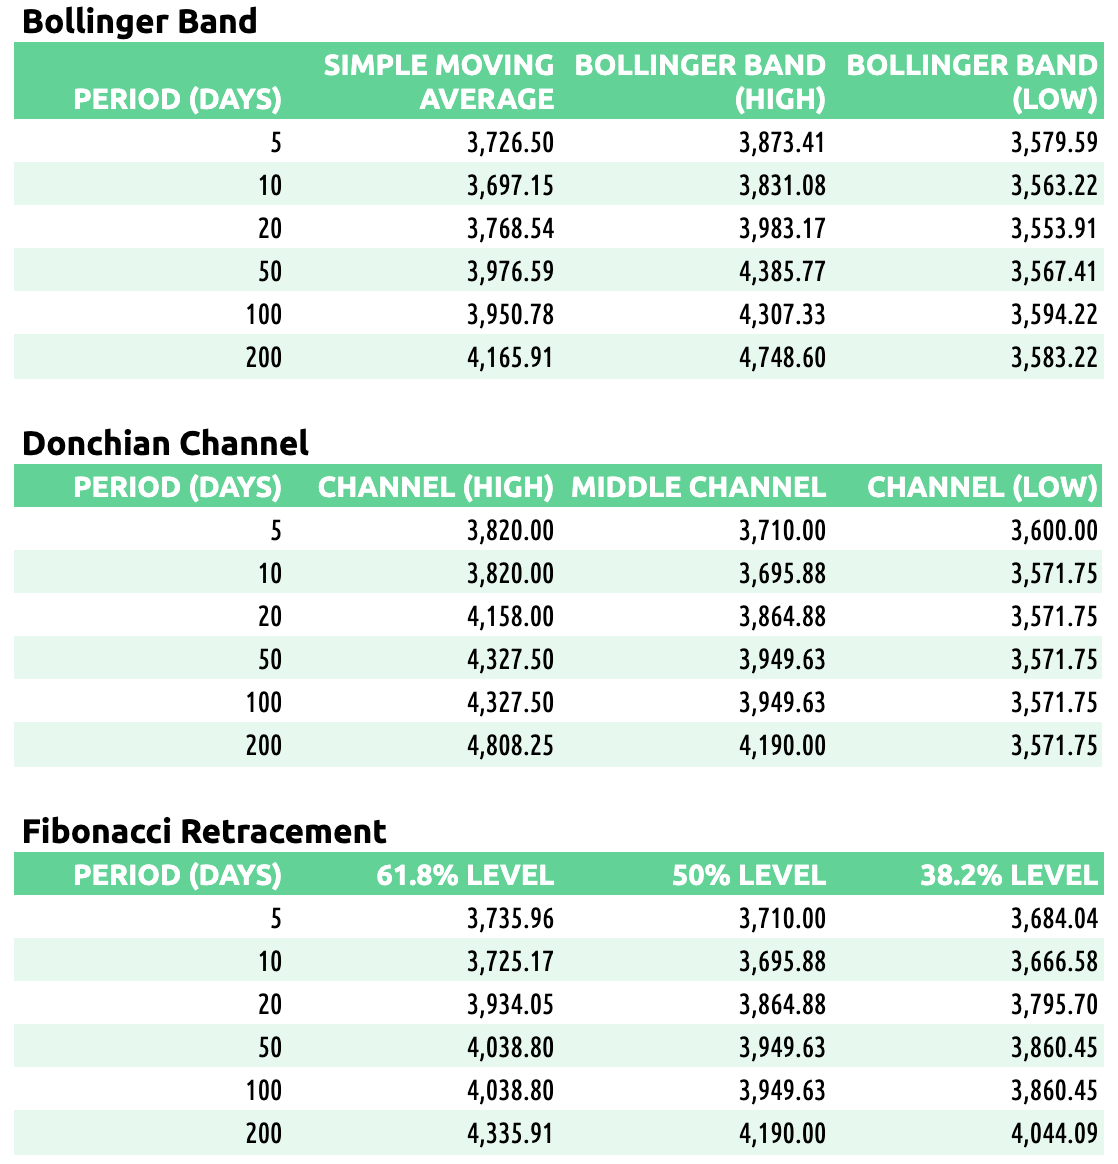
Technicals
E-mini S&P 500 Volume/Market Profile
ES Composite Volume Profile (5 days)
Here is a chart of the past five sessions with a composite ETH Volume Profile:
ES ETH/RTH Split Volume Profile (5 days)
Here is a chart of the past five sessions with a daily ETH/RTH split Volume Profile:

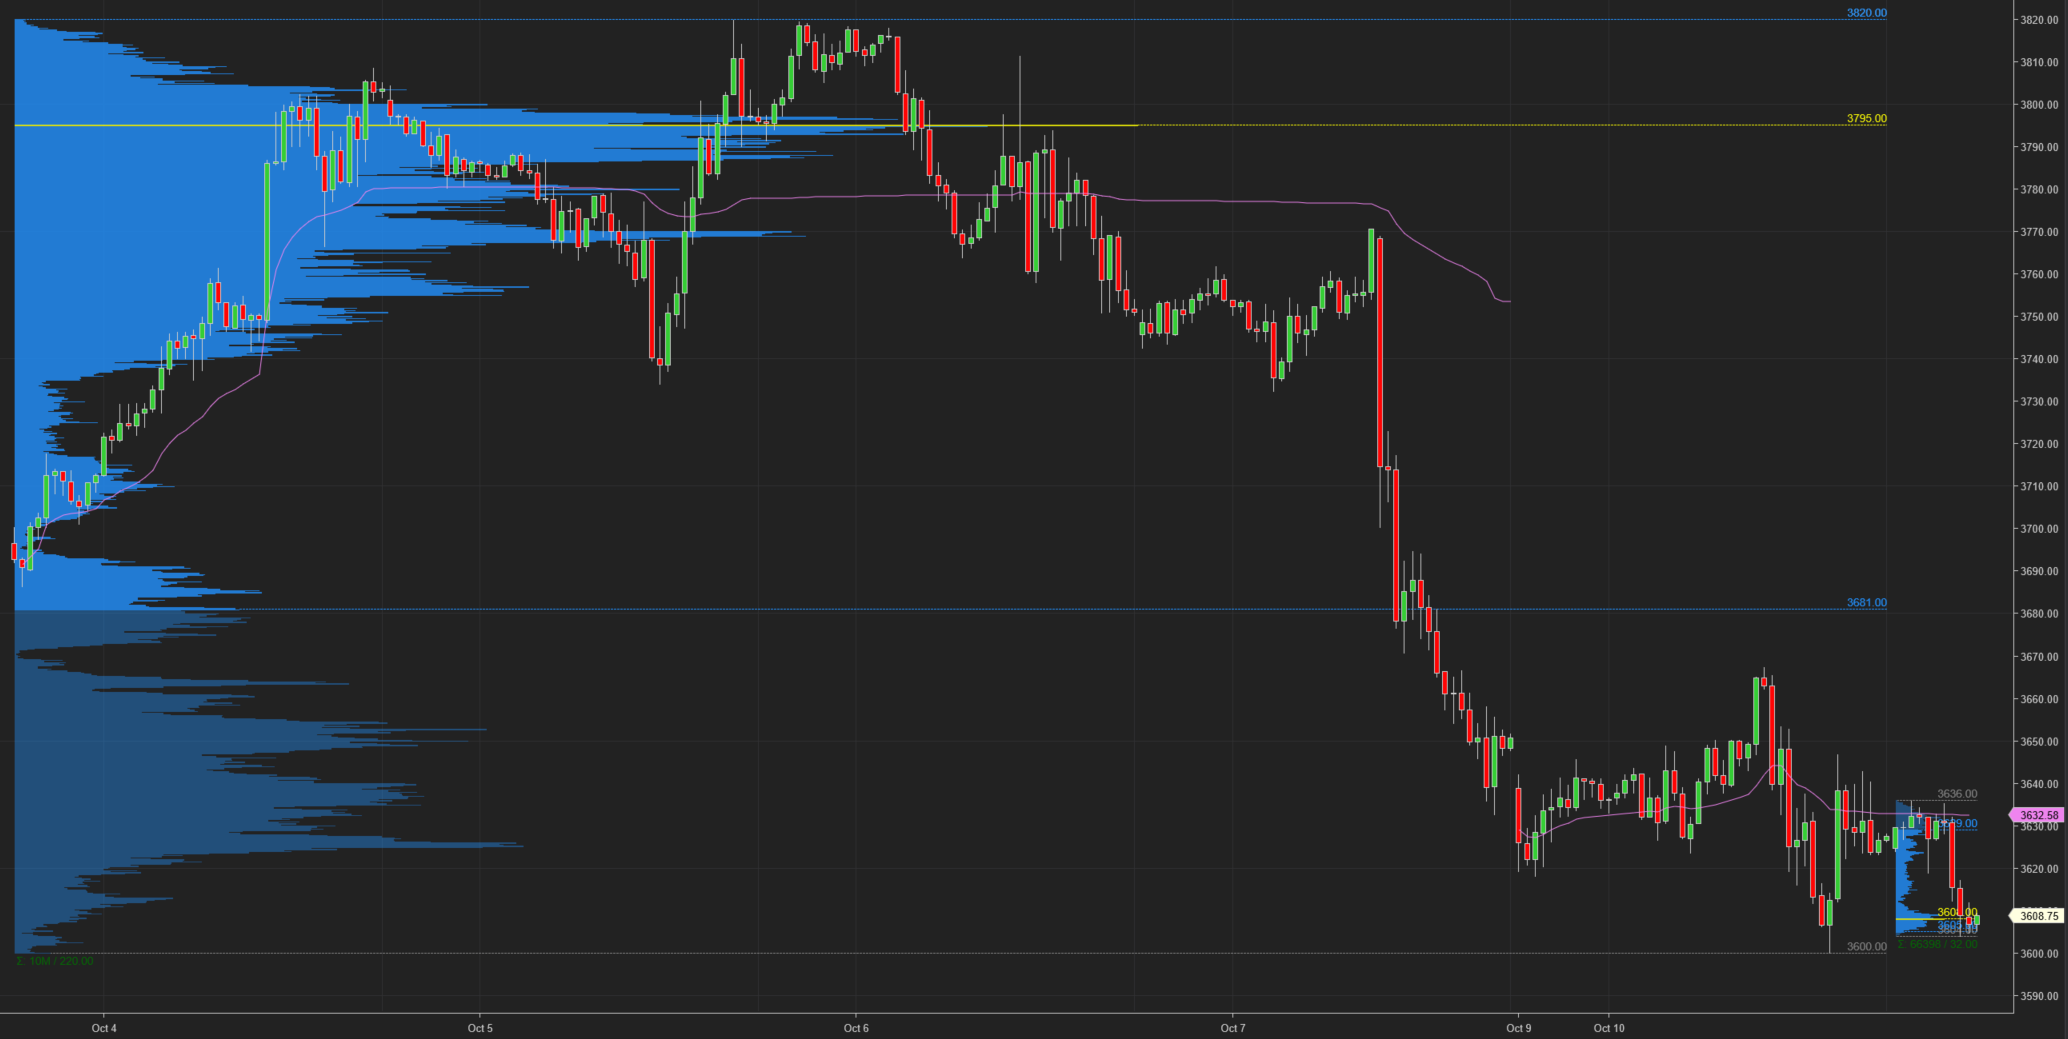
ES ETH/RTH Split Market/Volume Profile (today)
Profile Description: D-shaped profile. The HVN was in the center of the profile.
Here’s a TPO chart of today’s session with ETH/RTH split Market/Volume Profile:

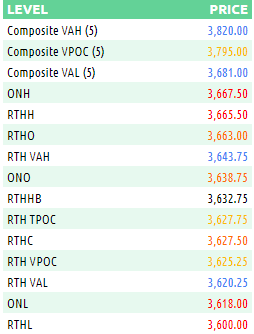
ES Market/Volume Profile Levels
RTH Weak High/Low: n/a
RTH Single Prints: n/a
RTH Excess: 3600 to 3606.25; 3653.50 to 3665.50
RTH Gap: None but 10/07/22 gap still exists.
Session Recap
Electronic Trading Hours (ETH)
Globex Session:
Wholesale was short at the prior day’s close. The ONO was inside the prior day’s value area. Inventory during Globex was 94% short. Supply pushed the auction beneath the prior day’s low to begin the Asian open. ON supply ran out at 3618, and buyers lifted ES over VWAP and back into the prior day’s range and value area. The auction went sideways for several hours crossing back and forth through the prior day’s low. When London opened up, longs tried to lift the offer but met supply at 3649. Supply dropped the auction but couldn’t get underneath the session’s low. ES balanced and finally some buyers stepped in right before the NY open. Longs lifted ES above the previous day’s VPOC but couldn’t get test the VAH. The VPOC was 3664. Offers were trapped in the gap above prior to Friday RTH. There is overhead supply.
Range: 49.50
Regular Trading Hours (RTH)
US Session:
The RTH open was inside of the prior day’s value area in underneath the T+2 low. Supply overwhelmed any demand at the start of RTH. ES fell 30-handles in the first hour. Buyers stepped in at 3632.50 to stabilize the fall momentarily. At 3653.50, buyers faded and ES erased the ONL by dropping 40 more points to 3616. Buying came back in momentarily to provide a 20-points bounce. At 3637.75, buyers could no longer lift the offer and ES fell another 37-points. Supply ran out at 3600 during H-period. Buyers lifted the offer amid lack of supply for a 47-point bounce. At 3647, supply was able to absorb the buying. ES traded sideways for the remainder of RTH in a 20-point channel.
Range: 65.50