
Candles & Ticks | Daily Digest 09/29/2022
Stocks slide to give back all of yesterday's rally. S&P 500 sets another intraday and closing low for 2022.

Market Overview

Every index fell as the S&P 500 set a new 2022 closing low for the third time this week. Ten S&P sectors finished red with utilities (XLU 0.00%↑) falling the most. Energy (XLE 0.00%↑) was flat on the day. Everest Re Group RE 0.00%↑ was the S&P’s best performer rising 2.82%. The worst S&P performer was Carmax KMX 0.00%↑ which fell 25% after their earnings miss flashes a warning sign about the US consumer. Apple AAPL 0.00%↑ and Tesla TSLA 0.00%↑ also lost more than 4.5% each, headlining losses from the large mega-caps. After falling for two straight sessions, the 2-year Treasury was back up over 4.2% today before sliding back some. The 10-year T-Note also rose on the day.
Here are some of today’s closing prices.

E-mini S&P 500 Top-Down Analysis

Below are the monthly (5-years), weekly (2-years) and daily (6-months) charts for ES.
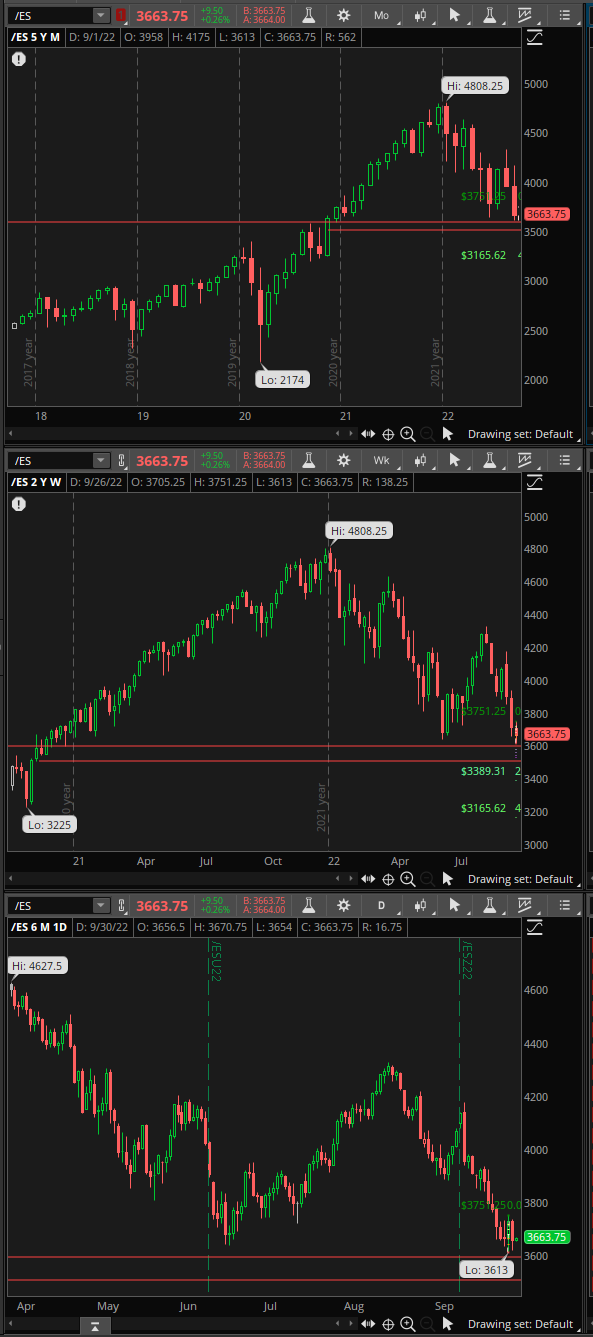
M/M: After rallying above the high of the previous 3-months, August lost 4% M/M. It closed below the midpoint from the prior 3-month range. ES has been balancing from May to August. Unless the month of September can eclipse the 4327.5 August high, ES will be OTFD.
W/W: ES has lost 4% or greater for two straight weeks. It’s trending down as it failed to trade above the previous week’s high and has traded well below the prior week’s lows.
D/D: ES fell and erased all of the prior day’s gains. ES has been in balance the previous four sessions in a zone from 3613 to 3751.25.
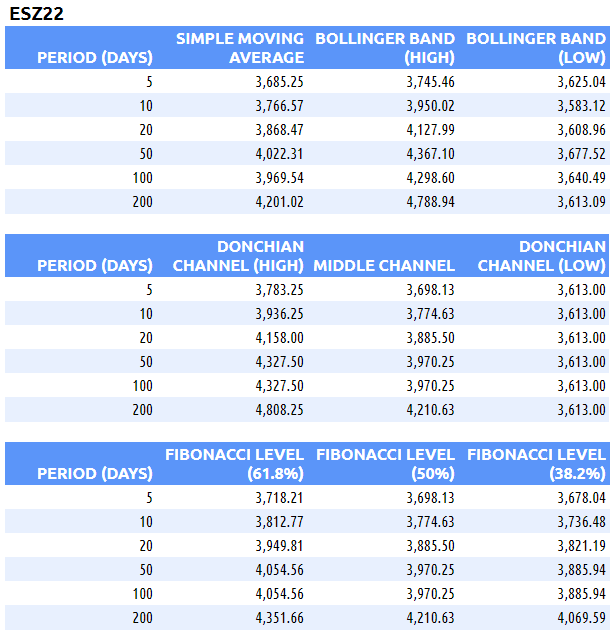
E-mini S&P 500 Metrics
Recent History and Performance

Technicals
E-mini S&P 500 Volume/Market Profile
ES Composite Volume Profile (5 days)
ETH VAH: 3717
ETH VPOC: 3709.50
ETH VAL: 3651
Here is a chart of the past five sessions with a composite ETH Volume Profile:

ES RTH Volume Profile (today)
RTH VAH: 3662.50
RTH VPOC: 3655
RTH VAL: 3636.50
Here is a chart of the past five sessions with a daily ETH/RTH split Volume Profile:
ES RTH Market Profile (today)
RTH TPOC: 3656
RTH Poor Low/High: n/a
RTH Single Prints: n/a
RTH Excess: 3622 to 3623.75; 3672.75 to 3697.50
Here’s a TPO chart of today’s session with ETH/RTH split Market Profile:
Session Recap
Electronic Trading Hours (ETH)
Globex Session:
Wholesale was long at the prior day’s close. The ONO was inside of the previous day’s value area. Inventory during Globex was about 80% short. The auction traded sideways for most of the Asian session with most price action between the prior day’s VAH and VPOC. There was overhead supply indicated by a triple top at 3736, where buyers couldn’t lift the offer a single tick higher. Just prior to the London open, buyers dissipated and supply pushed ES underneath VWAP and the prior day’s VAL. At 3677.25, buyers were found again and ES corrected up towards VWAP. Unable to follow through above VWAP, ES fell again to new session lows. At 3673.50 where supply emptied and ES rotated up towards VWAP to end Globex. The ON TPOC was around 3700 with VPOC about 10-handles lower at 3690.
ONO: 3730.25
ONH: 3736 ( poor high/triple top)
ONL: 3673.50
Range: 62.50
Regular Trading Hours (RTH)
US Session:
The RTH open was inside of the prior day’s value area and in between the T+2 low and high. At the opening bell, there was no bid to be found. In the first two TPO periods, supply dropped ES 60-handles to get beneath the ONL, prior day’s LOD and T+2 low. At 3631.25, shorts covered and the buying temporarily lifted ES 40-handles. The covering ended in the face of supply near VWAP. Sellers lowered ES 50-points and to new session lows. At 3622, supply emptied and shorts covered to stabilize the fall. ES bounced 40-points to close RTH at 3658.75.
O: 3694.25
H: 3697.50
L: 3622
Range: 75.50