
Candles & Ticks | Daily Digest 09/28/2022
Equities bounce as Treasury yields slip. Energy and communications lead the way. US pending-home sale fall in August for third straight month.

Market Overview

Equities had a positive showing today with Treasury yields falling. Every index rose, led by the Russell which gained 3%. Every index was positive with Energy, XLE 0.00%↑, and Communications, XLC 0.00%↑, leading the way. Biogen BIIB 0.00%↑ was the leading company in the S&P 500 and Nasdaq on news that it’s Alzheimer’s drug showed positive results in slowing cognitive and functional decline. Yields on the 2-year and 10-year T-Notes fell to 4.13% and 3.73% which helped stocks, as well. The National Association of Realtors’ monthly index showed that US pending-home sales fell 2% last month, more than the forecasted 1.4%.
Here are some of today’s closing prices.

E-mini S&P 500 Top-Down Analysis

Below are the monthly (5-years), weekly (2-years) and daily (6-months) charts for ES.

M/M: After rallying above the high of the previous 3-months, August lost 4% M/M. It closed below the midpoint from the prior 3-month range. ES has been balancing from May to August. Unless the month of September can eclipse the 4327.5 August high, ES will be OTFD.
W/W: ES has lost 4% or greater for two straight weeks. It’s trending down as it failed to trade above the previous week’s high and has traded well below the prior week’s lows.
D/D: ES had a wide range today and traded beyond the prior day’s low and high. Unable to accept beneath the prior day’s low, ES rotated up and closed near the top part of the balance zone.
E-mini S&P 500 Metrics
Recent History and Performance

Technicals

E-mini S&P 500 Volume/Market Profile
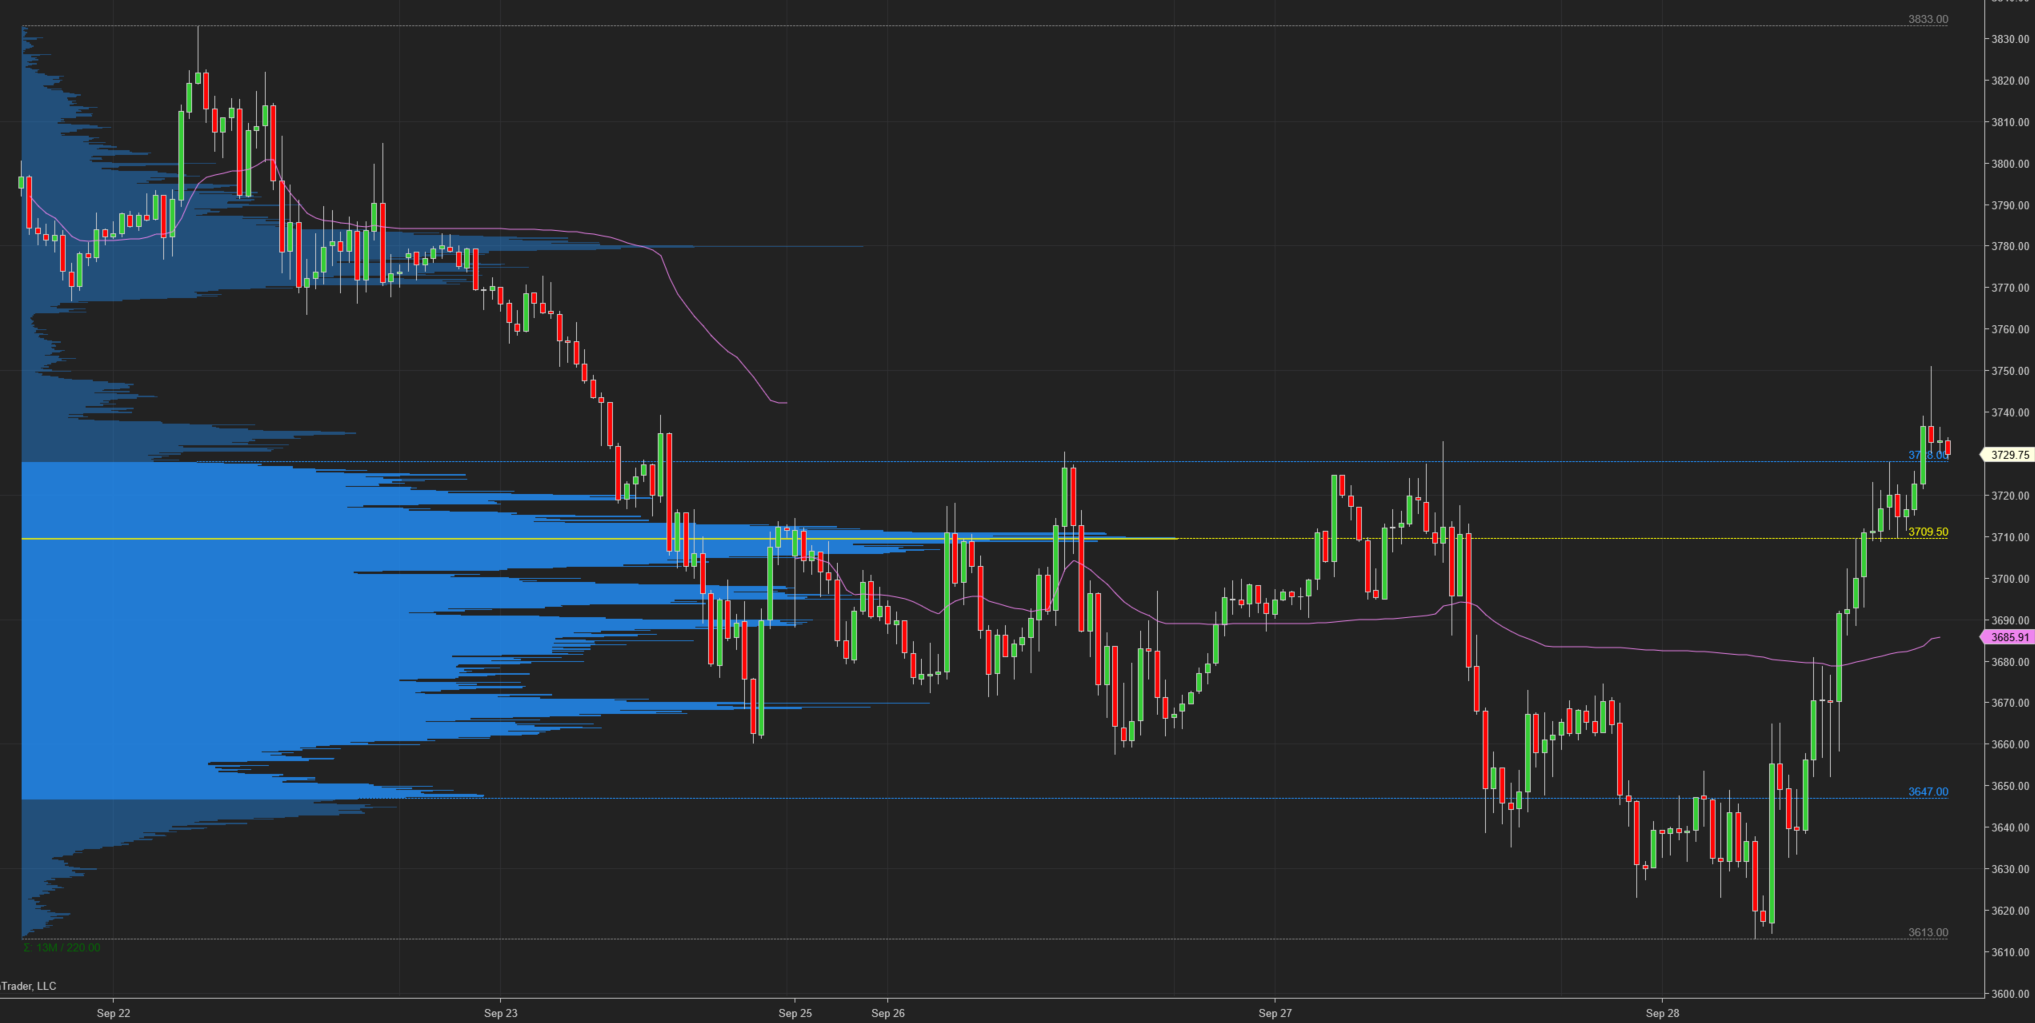
ES Composite Volume Profile (5 days)
ETH VAH: 3728
ETH VPOC: 3709.50
ETH VAL: 3647
Here is a chart of the past five sessions with a composite ETH Volume Profile:
ES RTH Volume Profile (today)
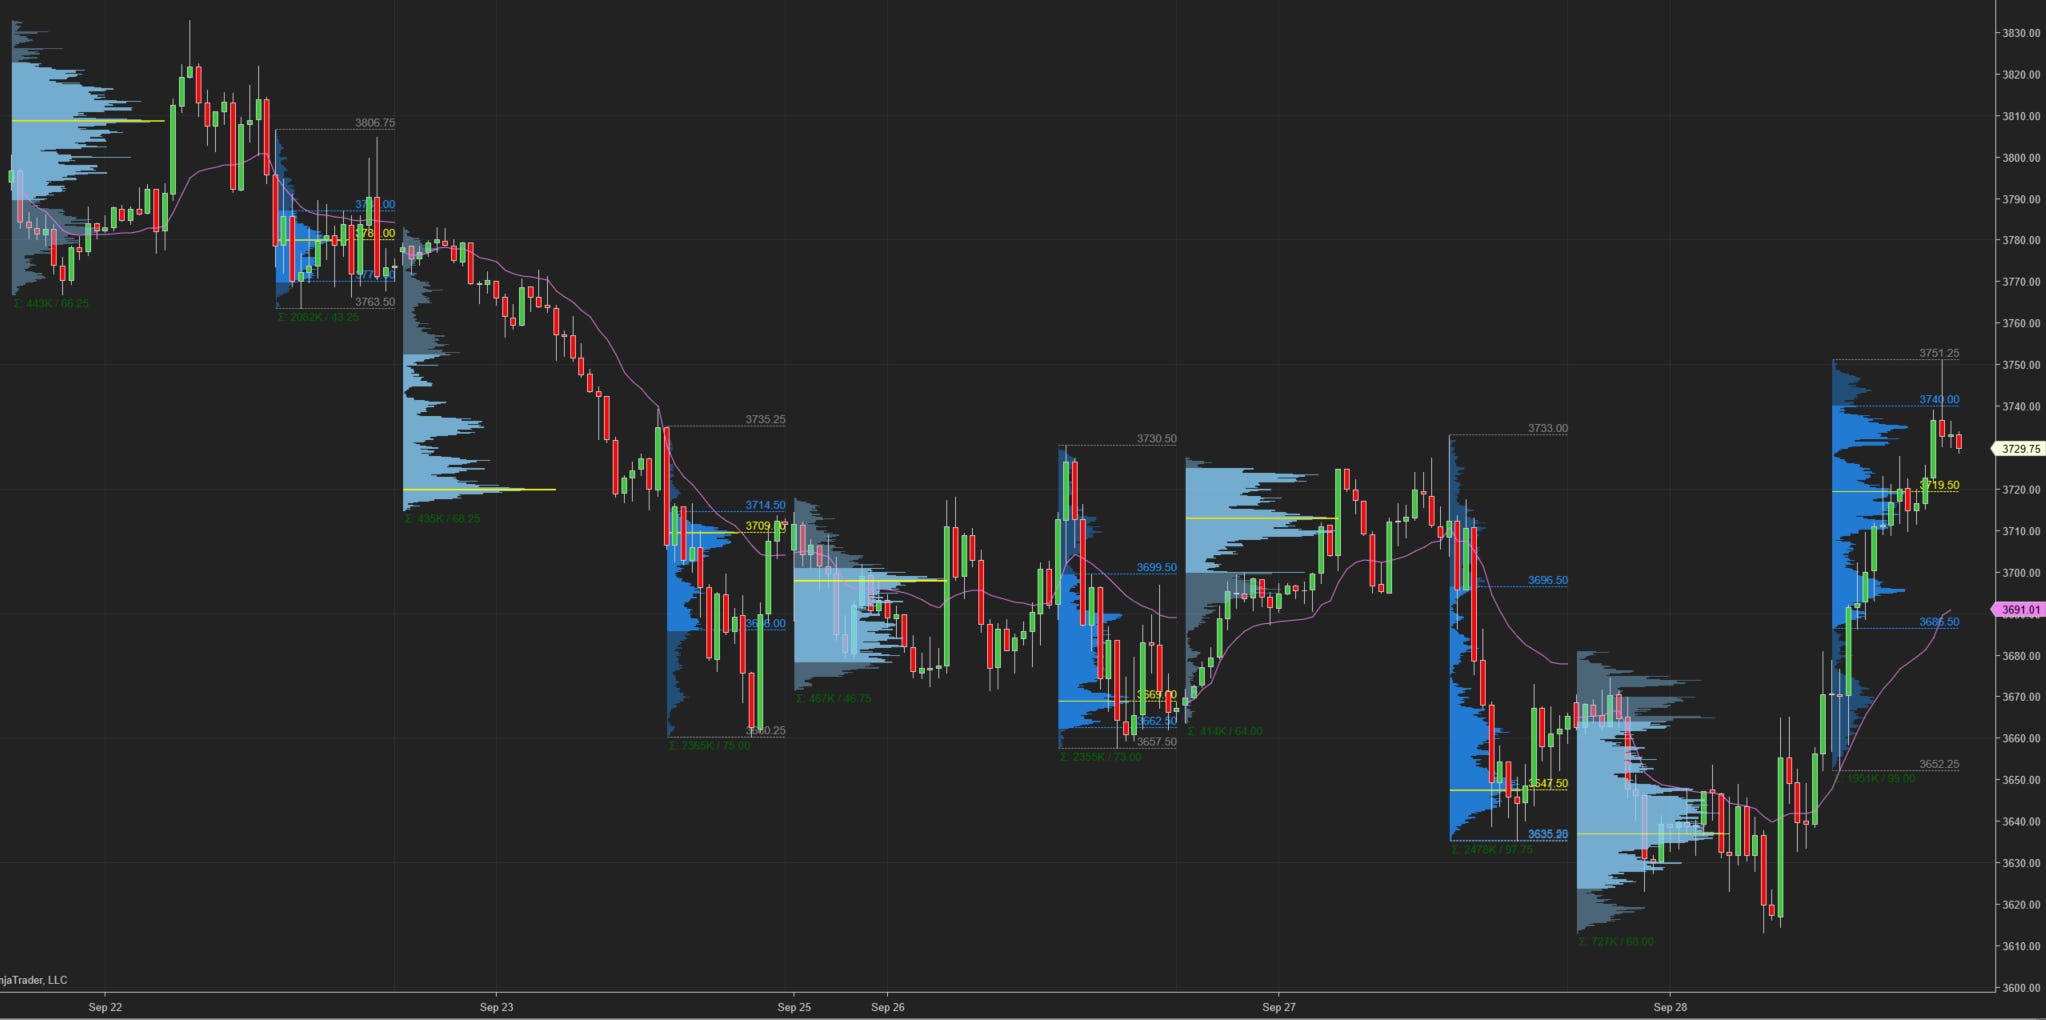
RTH VAH: 3740
RTH VPOC: 3719.50
RTH VAL: 3686.50
Here is a chart of the past five sessions with a daily ETH/RTH split Volume Profile:
ES RTH Market Profile (today)
RTH TPOC: 3711.75
RTH Poor Low/High: n/a
RTH Single Prints: 3676.75 to 3686.25
RTH Excess: 3652.25 to 3658.25; 3739.25 to 3751.25
Here’s a TPO chart of today’s session with ETH/RTH split Market Profile:

Session Recap
Electronic Trading Hours (ETH)
Globex Session:
Wholesale was short at the prior day’s close. The ONO was inside of the prior day’s value area. Inventory during Globex was mostly short. During the Japan session, longs failed to bring ES over 3674.75. ES then corrected and accepted down underneath VWAP. ES fell to 3623, taking out the prior day’s LOD. The auction then was in balance and slowly crept upward but failed to get over VWAP. After the London open, supply moved ES lower and took out the prior session low. At 3613, supply shut off and the auction 50-points over the next few TPO periods to get back into the previous day’s value area. ES backfilled before more buyers came and hit the offer to raise ES to new session highs. VPOC for Globex was 3636.75.
ONO: 3668.50
ONH: 3681
ONL: 3613
Range: 68
Regular Trading Hours (RTH)
US Session:
The RTH open was inside of the prior day’s value area and between the T+2 low and high. After the opening bell, ES fell beneath the T+2 low but there wasn’t enough supply to push lower. From 3652.25, ES rotated up. Wholesalers saw the bid and ES rose above VWAP as they distributed to the demand. ES was OTFU from A through F-TPO periods before it began to balance. At 3728, buyers eased up and large traders backfilled. In the final hour of NYSE, supply was pulled and ES rose above the prior day’s HOD and up to 3751.25 where supply was finally met again. ES fell 20-points off this high to end RTH at 3729.75.
O: 3670.50
H: 3751.25
L: 3652.25
Range: 99