
Candles & Ticks | Daily Digest 09/27/2022
S&P falls to new intraday and closing lows for 2022. Home prices cool at their fastest rate in S&P Case-Schiller index history.

Market Overview

The S&P and Dow each fell, while the Nasdaq and Russell gained in another volatile day. The S&P 500 hit a new intraday low and closing low for 2022. Four out of eleven S&P sectors finished green, led by energy. GS 0.00%↑ and BLK 0.00%↑ have downgraded equities amid rising interest rates. The 2-year T-Note hit 4.36% again today before pulling back. The 10-year Treasury got above 4% momentarily. The last time it’s been above 4% was October 2008. Lastly, although still higher than a year ago, home prices have tapered off at the fastest clip in the history of the S&P Case-Schiller index. The SPDR S&P Homebuilders ETF, XHB 0.00%↑, and the US’ largest homebuilder, DHI 0.00%↑, are down 36% and 37% YTD.
Here are some of today’s closing prices.

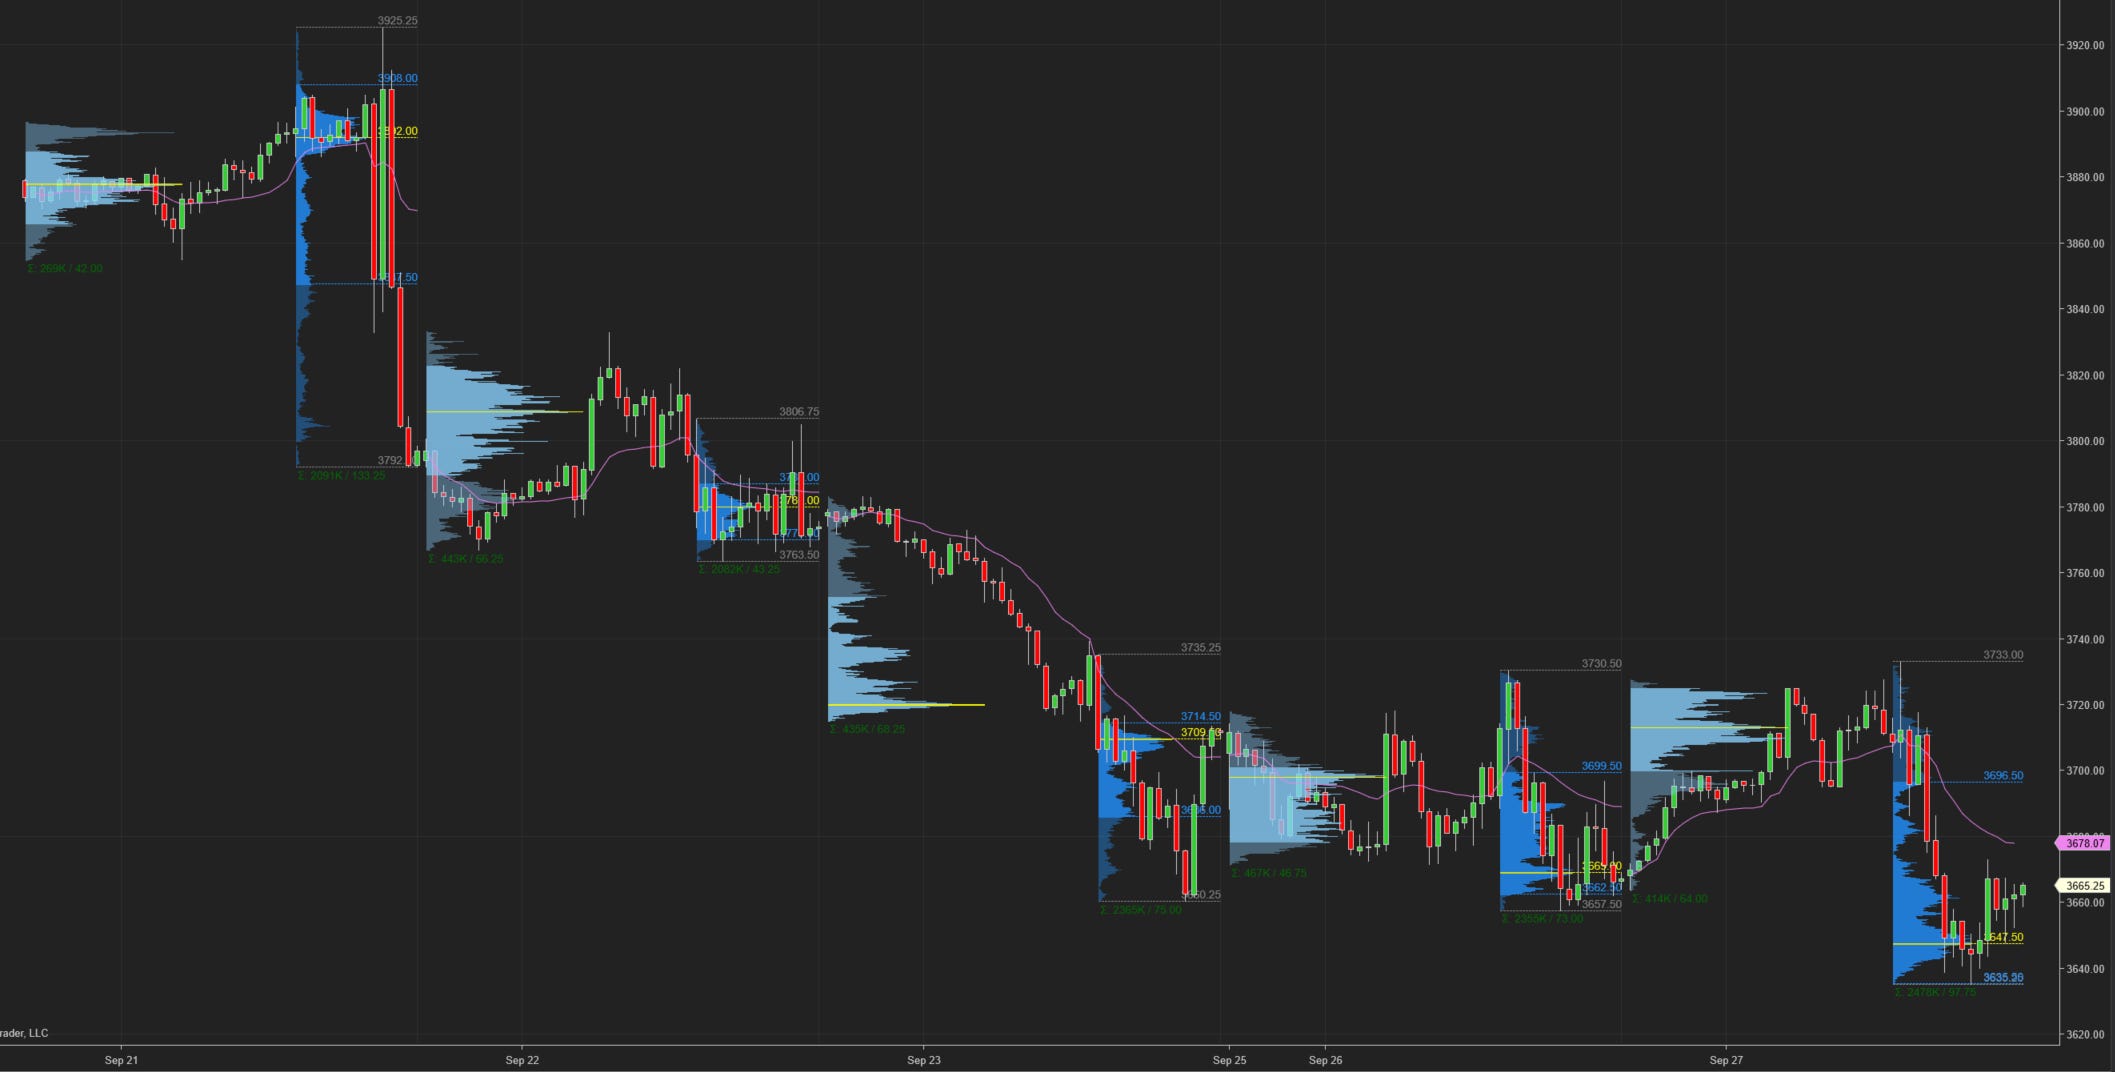
E-mini S&P 500 Top-Down Analysis

Below are the monthly (5-years), weekly (2-years) and daily (6-months) charts for ES.

M/M: After rallying above the high of the previous 3-months, August lost 4% M/M. It closed below the midpoint from the prior 3-month range. ES has been balancing from May to August. Unless the month of September can eclipse the 4327.5 August high, ES will be OTFD.
W/W: ES has lost 4% or greater for two straight weeks. It’s trending down as it failed to trade above the previous week’s high and has traded well below the prior week’s lows.
D/D: ES took out the prior day’s high to end OTFD. However, overhead supply pushed ES lower and it took out the 2022 intraday low. It could be in the beginning stages of forming a balance zone.
E-mini S&P 500 Metrics
Recent History and Performance

Technicals

E-mini S&P 500 Volume/Market Profile
ES Composite Volume Profile (5 days)
ETH VAH: 3778.50
ETH VPOC: 3709.50
ETH VAL: 3635.50
Here is a chart of the past five sessions with a composite ETH Volume Profile:

ES RTH Volume Profile (today)
RTH VAH: 3696.50
RTH VPOC: 3647.50
RTH VAL: 3635.50
Here is a chart of the past five sessions with a daily ETH/RTH split Volume Profile:
ES RTH Market Profile (today)
RTH TPOC: 3654.25
RTH Poor Low/High: n/a
RTH Single Prints: 3673.75 to 3675
RTH Excess: 3635.25 to 3638.75; 3717.75 to 3733
Here’s a TPO chart of today’s session with ETH/RTH split Market Profile:

Session Recap
Electronic Trading Hours (ETH)
Globex Session:
Wholesale was short at the prior day’s close. The ONO was inside of the prior day’s value area. Inventory during Globex was 100% long. Sellers couldn’t move ES beneath the prior day’s VAL. With shorts trapped underneath supplying the bid, buyers were able to raise ES above the previous day’s VAH. ES also remained above VWAP for most of the session. When shorts tried to move ES underneath VWAP, supply ran out each time so there wasn’t any follow through. Before RTH, ES came within 3-handles of the prior day’s high but couldn’t rise above. Supply absorbed the buyers and moved ES lower as it rotated back down towards VWAP.
ONO: 3668
ONH: 3727.75
ONL: 3663.75
Range: 64
Regular Trading Hours (RTH)
US Session:
The RTH open was inside of the prior day’s price range but above its value area. It was also in between the T+2 low and high. It was a volatile start after the opening bell. Buyers quickly lifted the auction 30-handles at the open to surpass the ONH. They encountered offers at this level and ES quickly fell 50-points to get back underneath VWAP and into the previous day’s value area. At 3686.25, buyers lifted ES back over VWAP. This rally quickly stalled at 3717.75 when heavy supply came and dropped ES 80-points during D, E and F-TPO periods. The prior day’s LOD and T+2 low were erased. Shorts covered to stabilize ES momentarily but it eventually fell to a new 2022 intraday low at 3635.25. Shorts covered and ES bounced 40-handles, ending RTH at 3665.25.
O: 3708.5
H: 3733
L: 3635.25
Range: 97.75