
Candles & Ticks | Daily Digest 09/26/2022
Dow officially enters bear territory and the S&P 500 suffers its lowest closing price for 2022.

Market Overview

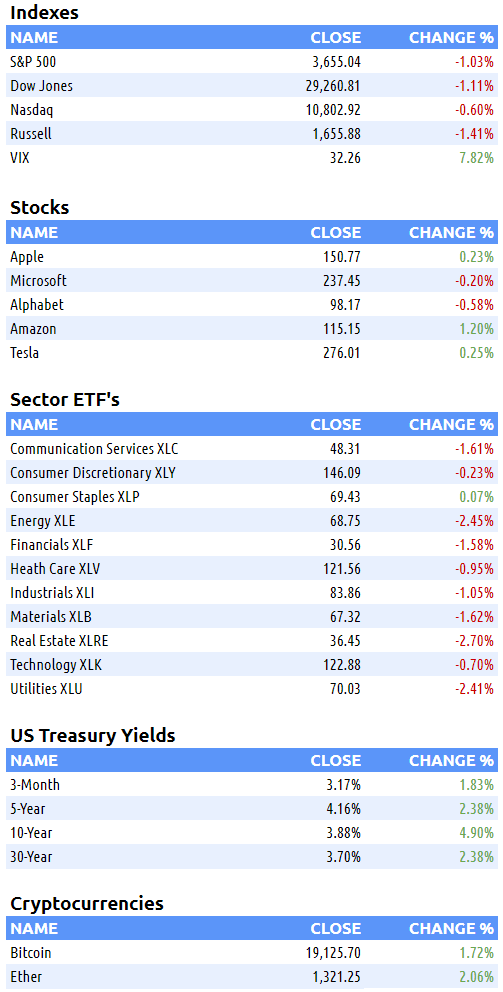
Equities continue to tumble. The Dow is officially in a bear market and the S&P 500 just set its lowest closing price for 2022, at 3655.04. On the day, the index got as low as 3644.76, inching closer to the 2022 intraday low of 3636.87. Despite giving back all of the 2021 gains, it’s still up pre-pandemic. Consumer staples was the only sector to end the day in the green. Yields on the 2-year and 10-year T-Notes continue to reach heights not seen in a decade plus. The 2-year reached 4.34% for the first time since August 2007. The 10-year hit 3.9% today, a new 12-year high (last seen April 2010). As interest rates go up, borrowing becomes more expensive for individuals and businesses. In theory, this results in compressed margins and earnings which leads to lower stock prices.
Events this week:
Sept. 27: Chicago Fed President Charles Evans speaks, Fed Chair Jerome Powell speaks on digital finance, Durable goods orders, Core capital goods orders, San Francisco Fed President Mary Daly speaks, S&P Case Shiller U.S. home price index (SAAR), FHFA U.S. home price index (SAAR), St. Louis Fed President James Bullard speaks, Consumer confidence index, New home sales (SAAR)
Sept. 28: Trade in goods, advance report, Atlanta Fed President Raphael Bostic speaks, Pending home sales index, Fed Chair Jerome Powell delivers opening remarks, Fed Gov. Michelle Bowman speaks on bank competition, Chicago Fed President Charles Evans speaks
Sept. 29: Initial jobless claims, Continuing jobless claims, Real gross domestic product revision (SAAR), Real gross domestic income revision (SAAR), Real final sales to domestic purchasers (SAAR), St. Louis Fed President James Bullard speaks
Sept. 30: PCE price index, Core PCE price index, PCE price index (year-on-year), Core PCE price index (year-on-year), Real consumer spending, Real disposable incomes, Fed Vice Chair Lael Brainard speaks, Chicago PMI, UMich consumer sentiment index (late), UMich 5-year expected inflation (late), Fed Gov. Michelle Bowman speaks on bank supervision, Richmond Fed President Tom Barkin speaks on what's driving inflation, New York Fed President John Williams speaks on financial stability
Here are some of today’s closing prices.
E-mini S&P 500 Top-Down Analysis
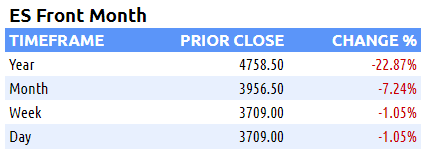
Below are the monthly (5-years), weekly (2-years) and daily (6-months) charts for ES.

M/M: After rallying above the high of the previous 3-months, August lost 4% M/M. It closed below the midpoint from the prior 3-month range. ES has been balancing from May to August. Unless the month of September can eclipse the 4327.5 August high, ES will be OTFD.
W/W: ES has lost 4% or greater for two straight weeks. It’s trending down as it failed to trade above the previous week’s high and has traded well below the prior week’s lows.
D/D: For the fourth straight day, ES failed to take out the prior day’s high and fell beneath the previous day’s LOD. ES is OTFD. 3639 is the next unbroken low on the daily timeframe.
E-mini S&P 500 Metrics
Recent History and Performance

Technicals

E-mini S&P 500 Volume/Market Profile
ES Composite Volume Profile (5 days)
ETH VAH: 3936
ETH VPOC: 3780
ETH VAL: 3707
Here is a chart of the past five sessions with a composite ETH Volume Profile:

ES RTH Volume Profile (today)
RTH VAH: 3699.50
RTH VPOC: 3669
RTH VAL: 3662.50
Here is a chart of the past five sessions with a daily ETH/RTH split Volume Profile:

ES RTH Market Profile (today)
RTH TPOC: 3675.25
RTH Poor Low/High: n/a
RTH Single Prints: n/a
RTH Excess: 3657.50 to 3659.25; 3727.50 to 3730.50
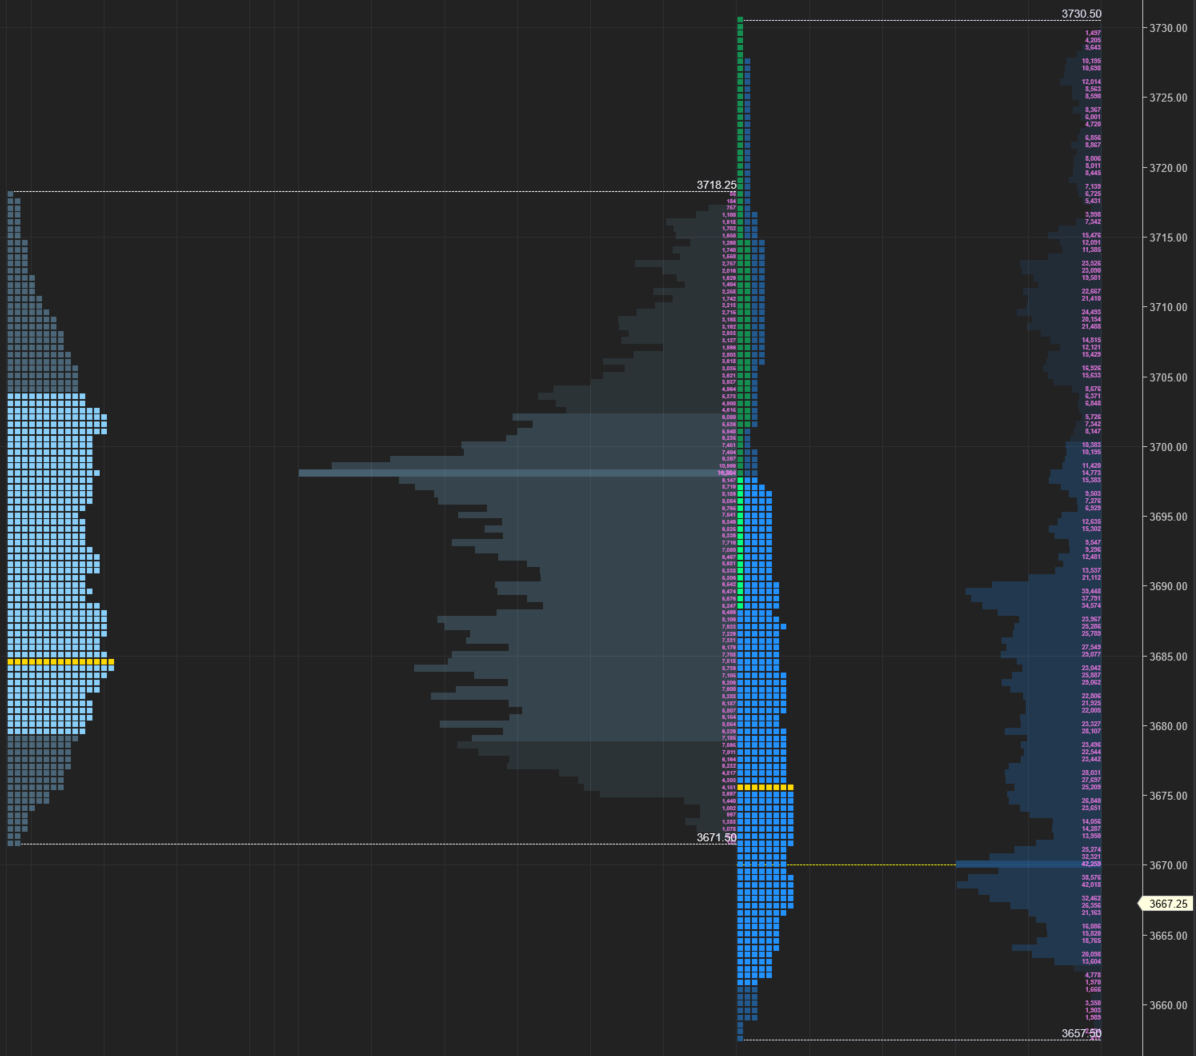
Here’s a TPO chart of today’s session with ETH/RTH split Market Profile:
Session Recap
Electronic Trading Hours (ETH)
Globex Session:
Wholesale was short at the prior day’s close. The ONO was inside of the prior day’s value area. Inventory during Globex was entirely short. It rotated back and forth in a 45-handle range but spent little to no time trading above the prior day’s 3711.50 close. Shorts were able to push ES below the prior day’s VAL but a poor low at 3671.50 was a sign of trapped shorts underneath providing a strong bid. On the first touch at that level, longs lifted ES over VWAP during the London open. They lifted ES above the prior day’s VAH momentarily before meeting supply at 3718.25. From there ES rotated back down but failed to get underneath 3671.50. Shorts covered and the lack of supply stabilized ES until RTH.
ONO: 3705.25
ONH: 3718.25
ONL: 3671.50
Range: 46.75
Regular Trading Hours (RTH)
US Session:
The RTH open was inside of the prior day’s value area but below the T+2 low. Lack of supply was evident after the NYSE opening bell. From the opening bell, buyers lifted the ask and brought ES over VWAP, the prior day’s VAH and ONH. ES got to 3730.50 in B-period and the buyers faded. Supply moved the auction back into the prior day’s value area. Supply continued to move the auction lower. Responsive buying was absorbed by sellers and eventually ES fell beneath the previous day’s VAL, LOD, and Globex ONL. Supply got exhausted down here and short covering lifted ES 30-points. The auction got up to VWAP momentarily before buyers ceased and ES fell again to within a few points of the session low. RTH ended at 3667.25.
O: 3692.25
H: 3730.50
L: 3657.50
Range: 73