
Candles & Ticks | Daily Digest 09/23/2022
It was a rough week all around following the Fed's FOMC announcement. The lows for the year are close.

Market Overview

The S&P 500 was within 10-points of the 2022 low, from mid-June. A late afternoon rally helped prevent that retest from occurring. It’s currently a 1.5% drop away from that level. Every index and sector was red on the day. In fact, every sector had a negative week. Energy suffered the most, losing 10% W/W. Crude oil closed the week underneath $80 for the first time since the first week of January. The 2-year gained 8.75% on the week to close at 4.2%, its highest since July 2007. The 10-year rose nearly 7% for the week to close at 3.69%, it’s highest since April 2010. The iShares Core US Aggregate Bond ETF is down 14.8% YTD, it’s worst year on record. In housing, 30-year fixed mortgages are at 6.29%, its highest level since October 2008. Below is the table for the S&P’s performance following the latest FOMC meeting. This time, it was down each day since the Fed announced the latest Fed Funds rate hike and revised their projections for the coming years. These are truly unprecedented times.

Here are some of today’s closing prices.

E-mini S&P 500 Top-Down Analysis

Below are the monthly (5-years), weekly (2-years) and daily (6-months) charts for ES.

M/M: After rallying above the high of the previous 3-months, August lost 4% M/M. It closed below the midpoint from the prior 3-month range. ES has been balancing from May to August. Unless the month of September can eclipse the 4327.5 August high, ES will be OTFD.
W/W: ES has lost 4% or greater for two straight weeks. It’s trending down as it failed to trade above the previous week’s high and has traded well below the prior week’s lows.
D/D: For the third straight day, ES failed to take out the prior day’s high and fell beneath the previous day’s LOD. ES is OTFD. The July 14th, June 22nd and June 17th lows were all erased today. 3639 is the next low on the daily timeframe.
E-mini S&P 500 Metrics
Recent History and Performance

Technicals

E-mini S&P 500 Volume/Market Profile
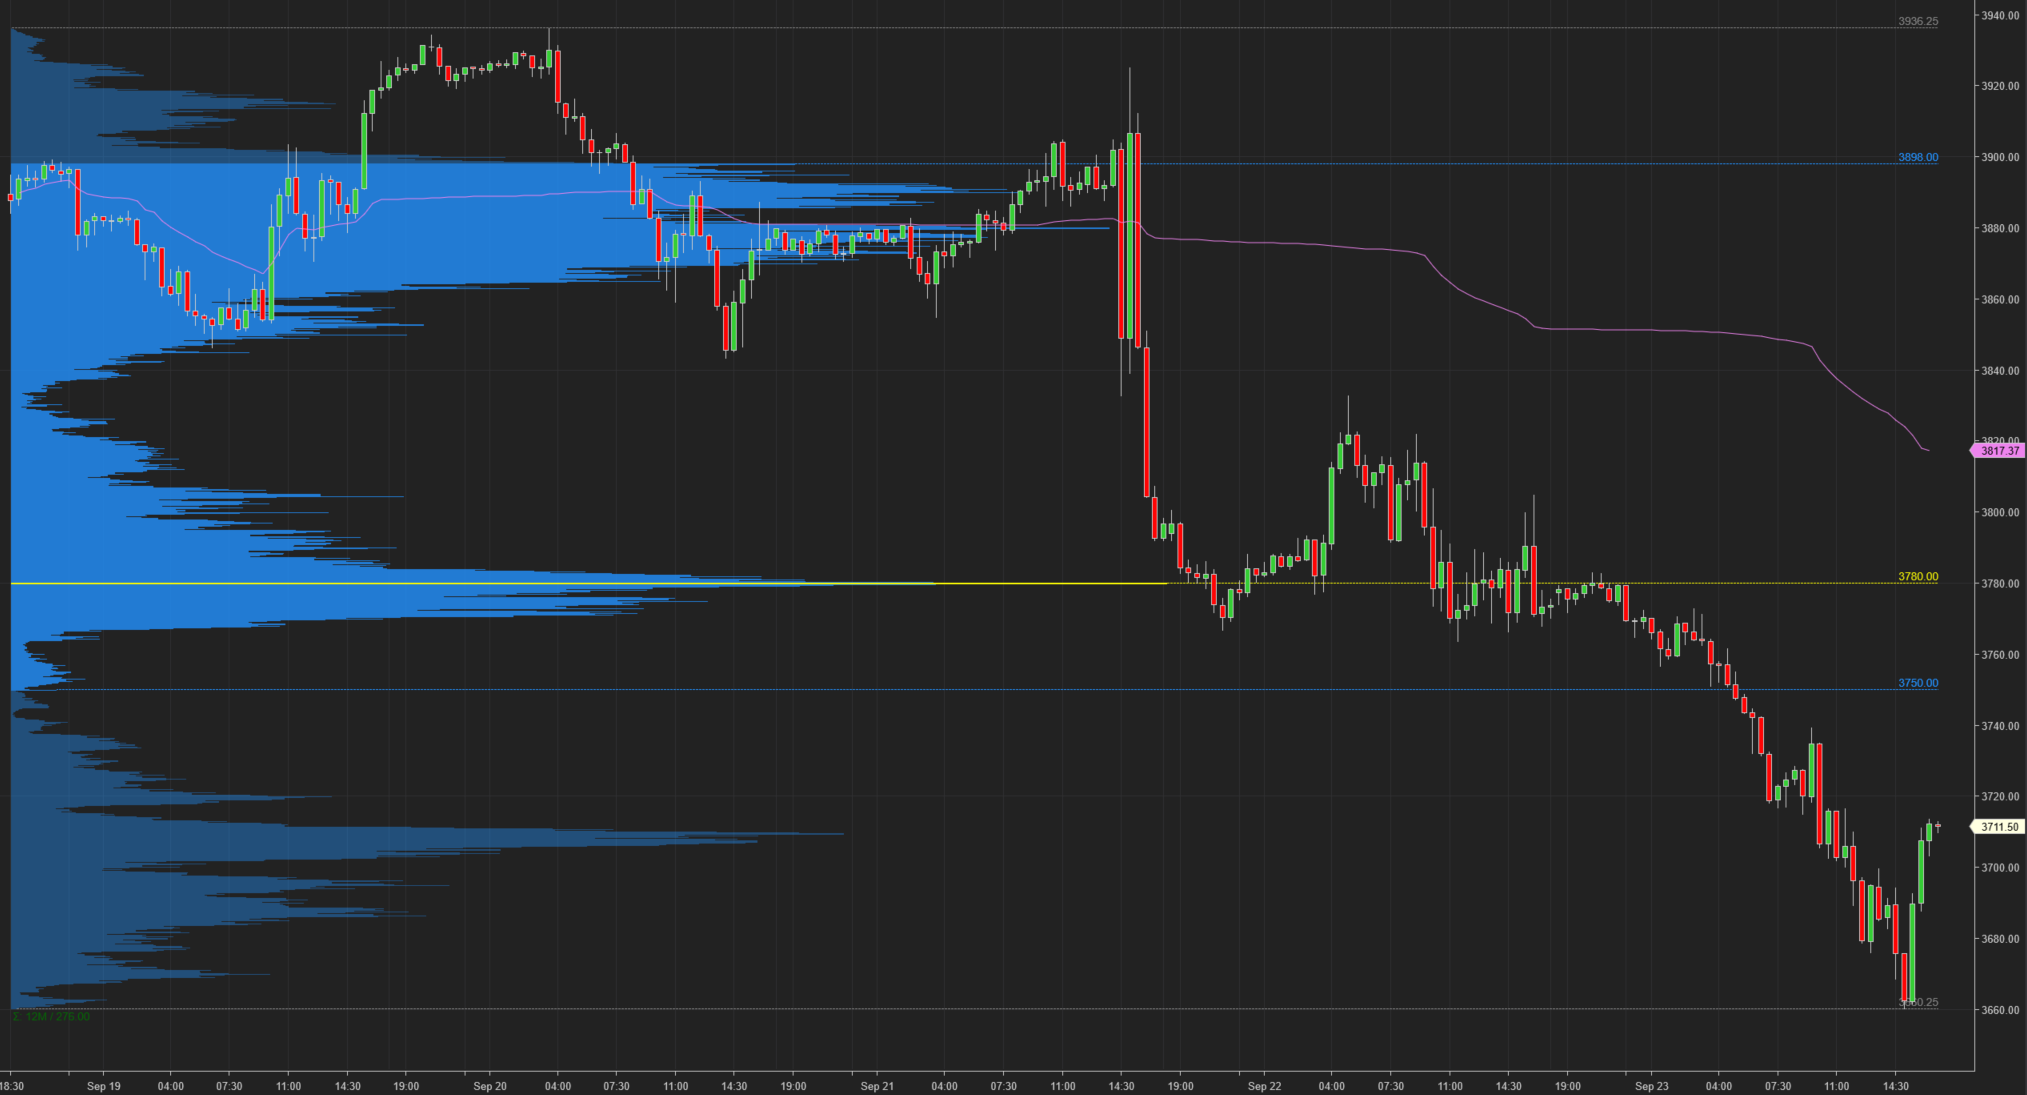
ES Composite Volume Profile (5 days)
ETH VAH: 3898
ETH VPOC: 3780
ETH VAL: 3750
Here is a chart of the past five sessions with a composite ETH Volume Profile:
ES RTH Volume Profile (today)
RTH VAH: 3714.50
RTH VPOC: 3709.50
RTH VAL: 3686
Here is a chart of the past five sessions with a daily ETH/RTH split Volume Profile:

ES RTH Market Profile (today)
RTH TPOC: 3691.25
RTH Poor Low/High: n/a
RTH Single Prints: n/a
RTH Excess: 3660.25 to 3661.50; 3716.75 to 3735.25
Here’s a TPO chart of today’s session with ETH/RTH split Market Profile:

Session Recap
Electronic Trading Hours (ETH)
Globex Session:
Wholesale was short at the prior day’s close. The ONO was inside the previous day’s value area, nearly 3-points beneath VPOC and 4-handles above the close. Inventory during Globex was mostly short, about 74% of the time. ES made a double top at 3783.25 early on in the session. Trapped long supply pushed the auction down as the Globex session continued, eventually falling beneath the previous day’s low.
ONO: 3777.25
ONH: 3783.25
ONL: 3715
Range: 68.25
Regular Trading Hours (RTH)
US Session:
The RTH open gapped down below the prior day’s low and was below the T+2 low. At the NYSE open, buyers managed to lift ES 2-ticks before encountering supply. The lack of demand sent ES falling 30-points in the first TPO period. ES continued to OTFD for the next few TPO periods, failing to take out the prior period’s high and erasing the low. At 3700, shorts began covering and the buying steadied the market. There was a brief 17-point rally. In E-period, buyers disappeared and supply broke through 3700. ES continued falling through F and G-periods. At 3676, there was another short covering rally in which ES failed to get back above 3700. At that point, ES rotated back down and supply continued to push to new lows for the session. At 3660.25, shorts came in to cover with supply shutting off. This spurred a 50-point rally in the final two hours of RTH. ES was negative for the day but managed to end RTH above 3700 and partially recover some of the losses.
O: 3734.75
H: 3735.25
L: 3660.25
Range: 75
The 3680 level had imbalance on the rally up where there was very few trades done on the bid. In addition, ES rose through this area without much on the offer either. This could be indicative of aggressive buying where sellers were lifting their offers higher as they sensed demand. There could be shorts trapped underneath here.
