
Candles & Ticks | Daily Digest 09/22/2022
The slide continues as the S&P inches closer to June lows.

Market Overview

The S&P 500 is now a 3% slide away from the 2022 intraday low from June 17th. Fun fact: 209 S&P companies, or 42% of the index, are less than 5% above their 52-week lows. In contrast, only 10 companies, or 2% of the index, are within 5% of their 52-week highs. In short, things are bad. Rising yields are putting pressure on stocks. The 3-month, 2-year and 10-year yields are up 2%, 6% and 7% this week, respectively. Every index was down again today and only one sector finished green: health care. Below is an update to the S&P’s performance around FOMC rate hikes for 2022.

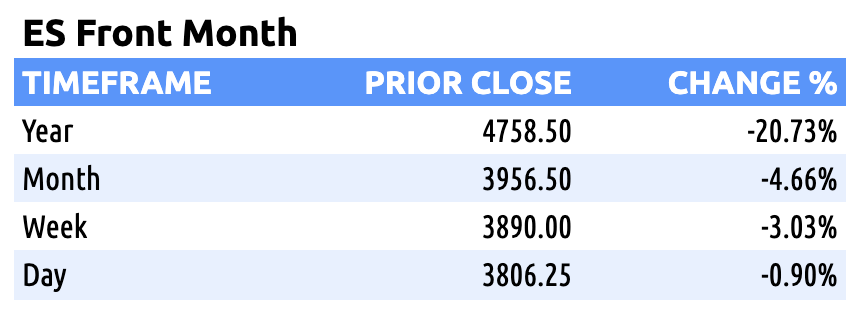
Here are some of today’s closing prices.

E-mini S&P 500 Top-Down Analysis
Below are the monthly (5-years), weekly (2-years) and daily (6-months) charts for ES.

M/M: After rallying above the high of the previous 3-months, August lost 4% M/M. It closed below the midpoint from the prior 3-month range. ES has been balancing from May to August. Unless the month of September can eclipse the 4327.5 August high, ES will be OTFD.
W/W: ES had its worst week since mid-June. For the past 3-weeks ES has been in balance.
D/D: For the second straight day, ES failed to take out the prior day’s high and fell beneath the previous day’s LOD. The low from July 15th was taken out. ES is OTFD. 3723.75 is the next low.
E-mini S&P 500 Metrics
Recent History and Performance

Technicals

E-mini S&P 500 Volume/Market Profile
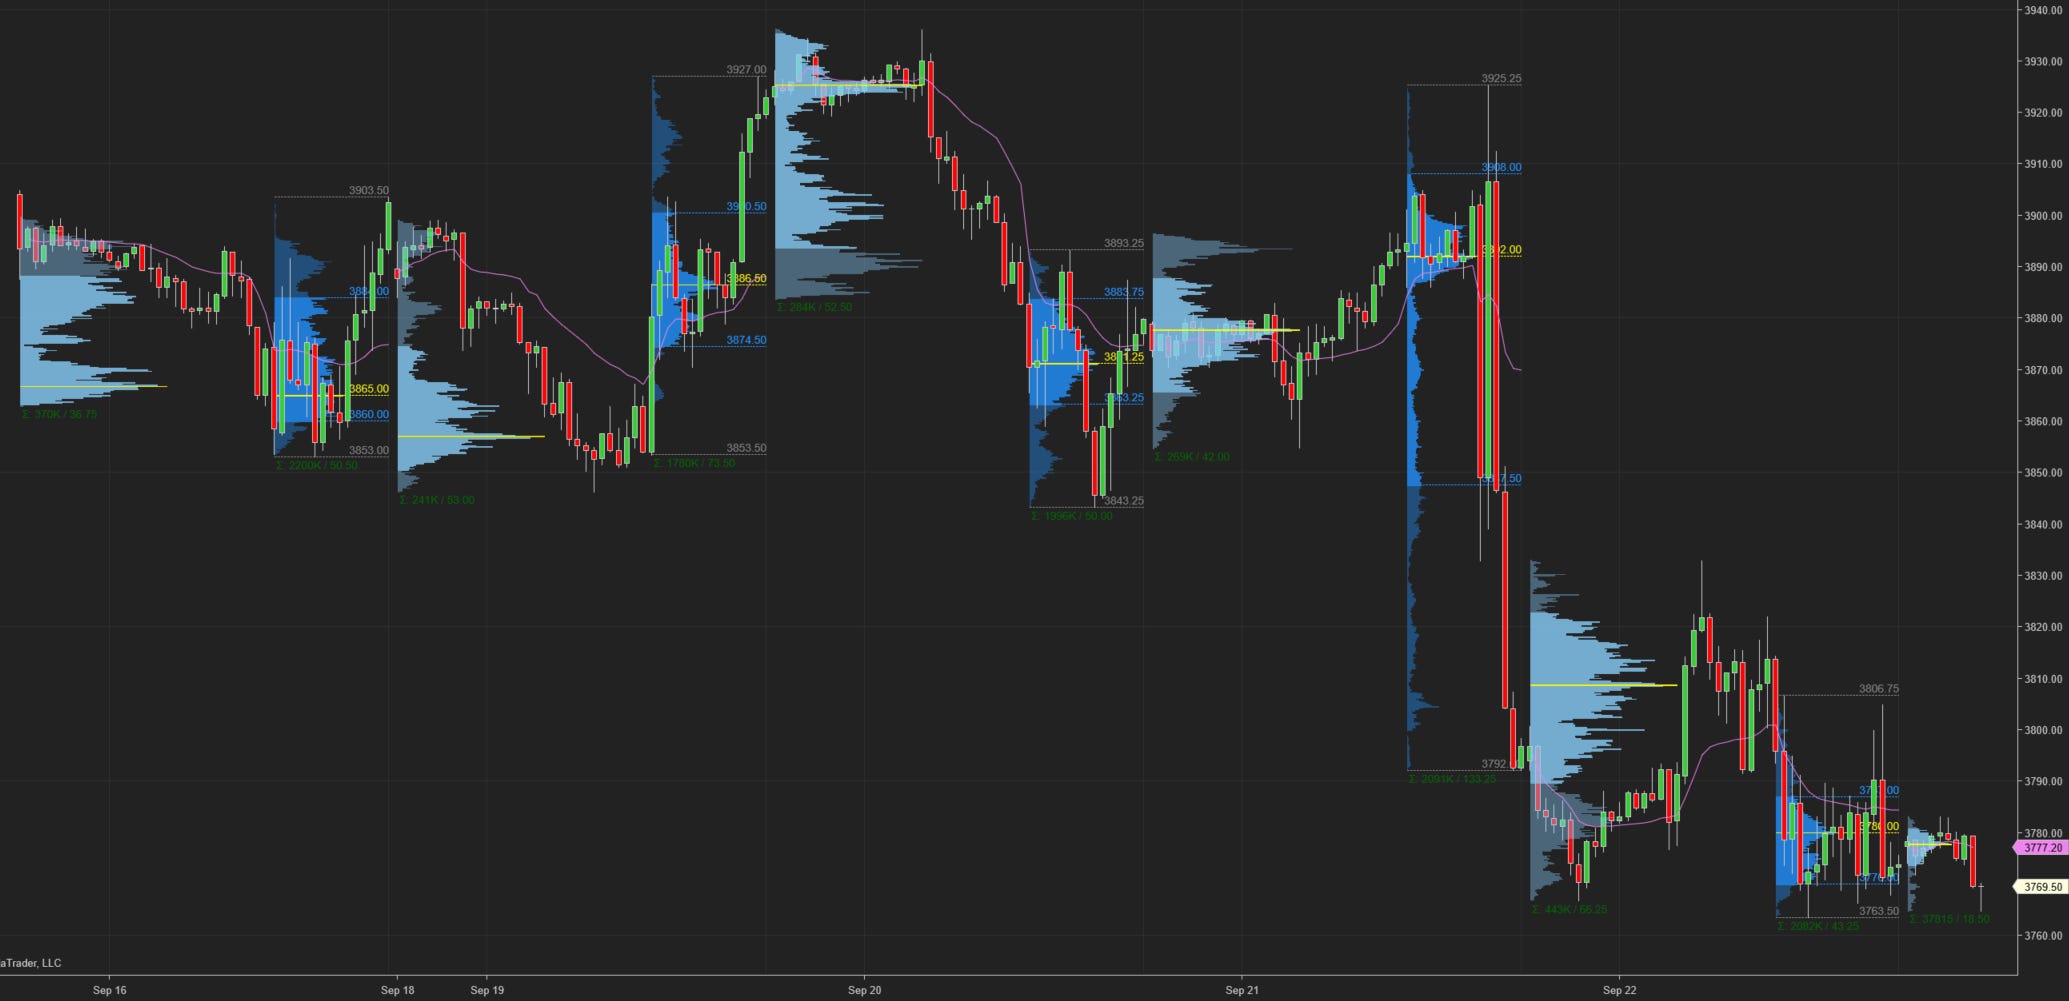
ES Composite Volume Profile (5 days)
ETH VAH: 3906
ETH VPOC: 3891
ETH VAL: 3841
Here is a chart of the past five sessions with a composite ETH Volume Profile:

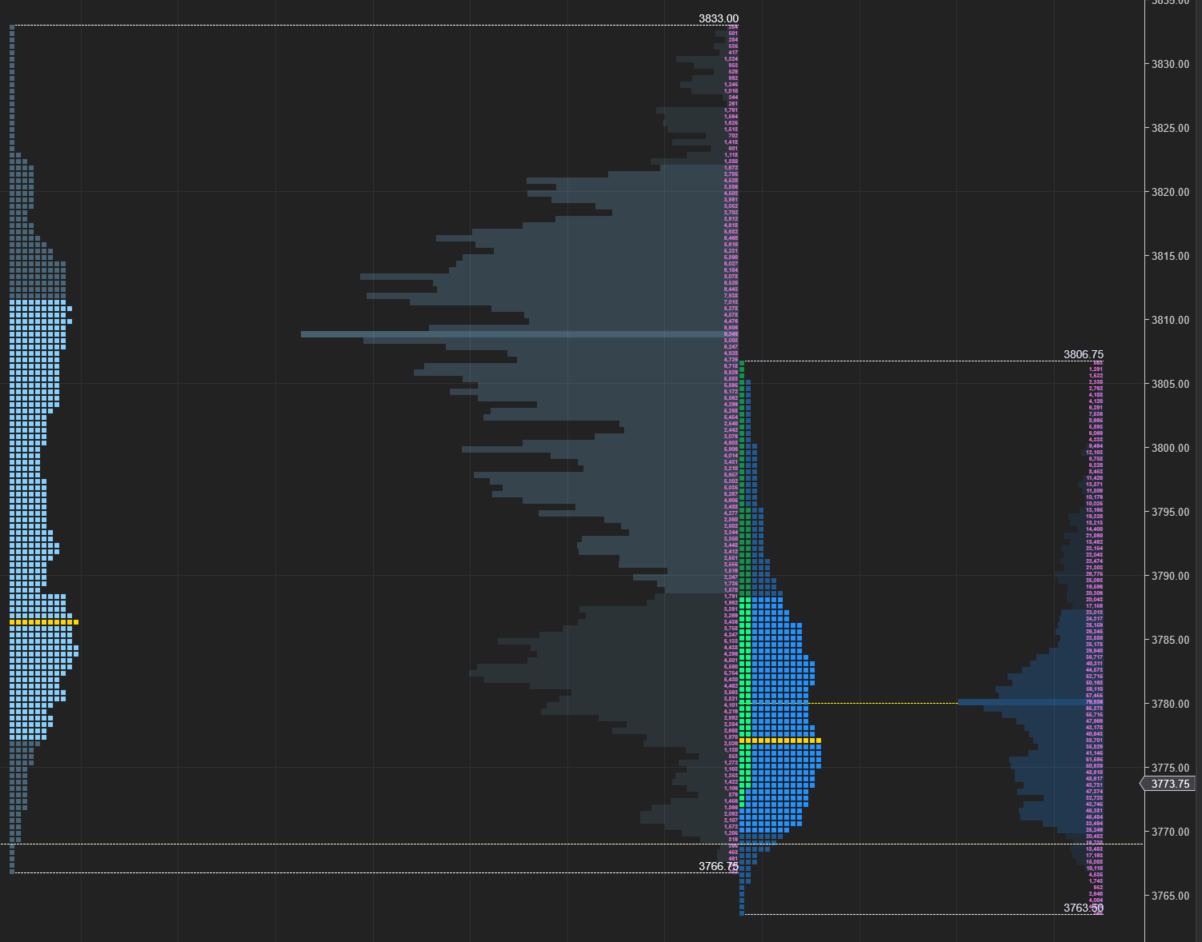
ES RTH Volume Profile (today)
RTH VAH: 3787
RTH VPOC: 3780
RTH VAL: 3770
Here is a chart of the past five sessions with a daily ETH/RTH split Volume Profile:
ES RTH Market Profile (today)
RTH TPOC: 3776.75
RTH Poor Low/High: n/a
RTH Single Prints: n/a
RTH Excess: 3763.5 to 3766.25; 3805 to 3806.75
Here’s a TPO chart of today’s session with ETH/RTH split Market Profile:
Session Recap
Electronic Trading Hours (ETH)
Globex Session:
Wholesale was short at the prior day’s close. The ONO was just inside the prior day’s LOD. Inventory during Globex was mostly short, about 65% of the time. Early in the session it dipped underneath the prior day’s low. It sank and eventually supply ran out at 3766.75. From there, ES rotated up towards VWAP. Once the London session opened, buyers were able to carry ES back into the previous day’s range and fill the single prints from the afternoon selloff. It got to 3833, 1-tick above the singles, before dropping lower. Longs were trapped the prior afternoon and created overhead supply. Supply pushed ES down below 3800 momentarily to 3791.5. Unable to accept under VWAP, ES rose again prior to RTH.
ONO: 3794
ONH: 3833
ONL: 3766.75
Range: 66.25
Regular Trading Hours (RTH)
US Session:
The RTH open was a few points inside of the prior day’s price range but beneath the value area. It was also underneath the T+2 low. Buyers tried to elevate the auction higher, but trapped longs provided the supply to move ES lower. It moved underneath the prior day’s low and was OTFD for the first few TPO periods, setting new RTH lows each time. In the fourth TPO period, the ONL was erased. Shorts covered at this point and ES bounced 20-handles. For the next few hours, it traded sideways in a 20-point range. As the day headed towards the NYSE close, shorts tried to sell but buyers stepped up in front of the session’s low. Longs lifted ES up over VWAP and a couple of ticks shy of the session high. Unable to stay above 3800, supply hit the market and moved it down 35-points. RTH ended at 3773.75.
O: 3795.75
H: 3806.75
L: 3763.5
Range: 43.25