
2022 Index Futures Volatility (part 1)

2022 has been a turbulent year in the stock market. There’s been no shortage of headlines and headwinds for risk assets. Below are some of the events that have been front and center through the first half of the year:
Fed interest rate hikes
Russia invades Ukraine
40-year high inflation
Yield curve inversion
S&P 500 enters bear market
These events have all contributed to an unsteady market. To assess sentiment, one can look at the VIX, also known as the CBOE Volatility Index. It measures the stock market’s expected volatility based on S&P 500 index options. When the VIX is higher, it’s usually a sign the market is selling off so stock prices are falling. Market conditions are usually erratic and unpredictable in this environment. A lower VIX usually accompanies a market that is being bought and has higher stock prices. Conditions tend to be calmer in this environment.
Below is a 5-year weekly chart of the VIX with a line at the 35 level. There’s been seven weeks where the VIX reached 35 and above in 2022, compared to just two weeks in all of 2021. In 2020, the VIX remained steady above 35 for three to four months. It was as high as 85 when Covid first took hold in the US. 2019’s VIX remained below 35 for the entire year. Finally, 2018 saw two weeks where the VIX rose above 35. That first instance was the week of February 5th, when the VIX got to 50. Ironically, it was the same week that Jerome Powell replaced Janet Yellen as Fed chair, amidst a rising interest rate environment like the one we’re currently in.
The point of this post is to look at this year’s volatility with respect to trading futures, specifically the S&P (/ES) and Nasdaq (/NQ). For speculators and short-term investors, the daily trading range (high minus low) can also provide insight regarding volatility. Ranges are larger in times of uncertainty and smaller in times of certainty. Large traders can also use this information to gauge potential profit targets.
I looked at the 2, 5, 10 and 20-year time periods ending in 2021 and calculated the average daily trading range by month for /ES and /NQ. All time periods indicate that the average range peaks in the month of March. The ranges decrease in the following months and through the summer. In September, they expand again and remain slightly elevated for the rest of the year.


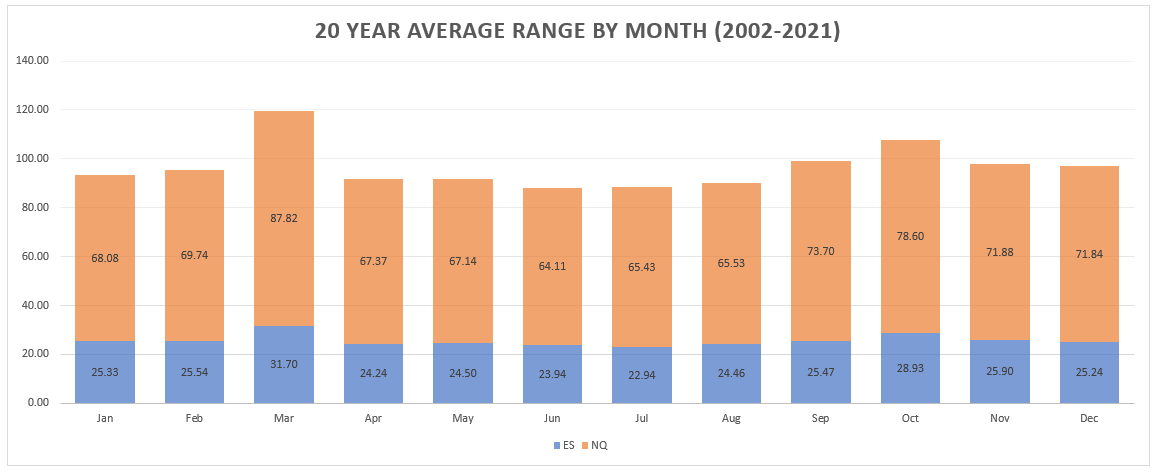
When doing the same analysis through the first six months of 2022, the average trading range for each month has been greater than all the time periods above except for one instance. The 2-year March sample, which includes 2020 and 2021, was the only month to have a larger average daily range than the 2022 sample for /ES and /NQ. This makes sense considering the Covid-induced market crash of March 2020 was in the 2-year sample.


At the time of this writing, the market is experiencing a typical summer lull. Yesterday’s VIX ranged from 19.43 to 20.61. The average day’s range for /ES has been 59.48 points the past 14 days. With September a few weeks away, will volatility and trading ranges increase again? One might wonder what the potential catalysts could be for this uptick. Here are some of the events that are happening in the next few months:
Three FOMC Meetings (September 20-21, November 1-2 and December 13-14)
Fed quantitative tightening to double in pace starting next month (Fed will let $60B in Treasuries and $35B in MBS roll off balance sheet…up from $30B and $17.5B, respectively)
November midterm elections
Markets don’t like uncertainty and the events above could potentially wobble markets and lead to some downside.
Links
https://www.barrons.com/articles/fed-balance-sheet-quantitative-tightening-2022-51659731026
https://am.jpmorgan.com/us/en/asset-management/institutional/insights/market-insights/investment-outlook/midterms/