
12/16/2022 Synopsis
Equities down again as investors digest all the data from the week and Fed Chair Powell's comments post-FOMC.

Market Overview

This is the final post for 2022. Will be back in 2023. Merry Christmas and Happy New Year everyone.
Here’s what happened on Friday. Equities all ended the week with a downer. The S&P 500 closed at its lowest level in over a month. Every sector was red with real estate falling the most. Communications held up the best only losing 0.02%.
Long duration treasury yields rose while shorter term yields dropped. The 3-month yield dipped 1 basis point to 4.21%. The yield on the 2-year note slid 5.5 bps to 4.19%. The 10-year climbed 4 bps to 3.49%.
The US Dollar index $DXY gained 0.22% to 104.84.
Crude oil rolled over 2.17% to close at 74.46.
Events this week:

Here are some of Friday’s closing prices.

E-mini S&P 500 Top-Down Analysis

📈 Below are the monthly (5-years), weekly (2-years) and daily (6-months) charts for ES.

M/M: ES is OTFU from October to November. It will have two consecutive green months for the first time since summer 2021. ES also closed November above its 10-month MA for the first time since March. ES has fallen below the 10-MA in December.
W/W: ES had an outside down week. Price action traded above the previous week’s high and beneath the previous week’s low. The week also closed underneath the previous week’s low and back below the 10-week MA.
D/D: ES is OTFD as it has failed to trade above the prior day’s high for three straight sessions.
E-mini S&P 500 Metrics
Recent Performance & Technicals


E-mini S&P 500 Volume/Market Profile
ES Composite Volume Profile (5 days)
📈 Here is a chart of the past five sessions with a composite ETH Volume Profile:

ES ETH/RTH Split Volume Profile (5 days)
📈 Here is a chart of the past five sessions with a daily ETH/RTH split Volume Profile:

ES ETH/RTH Split Market/Volume Profile (Friday)
📈 Here’s a TPO chart of Friday’s session with ETH/RTH split Market/Volume Profile:
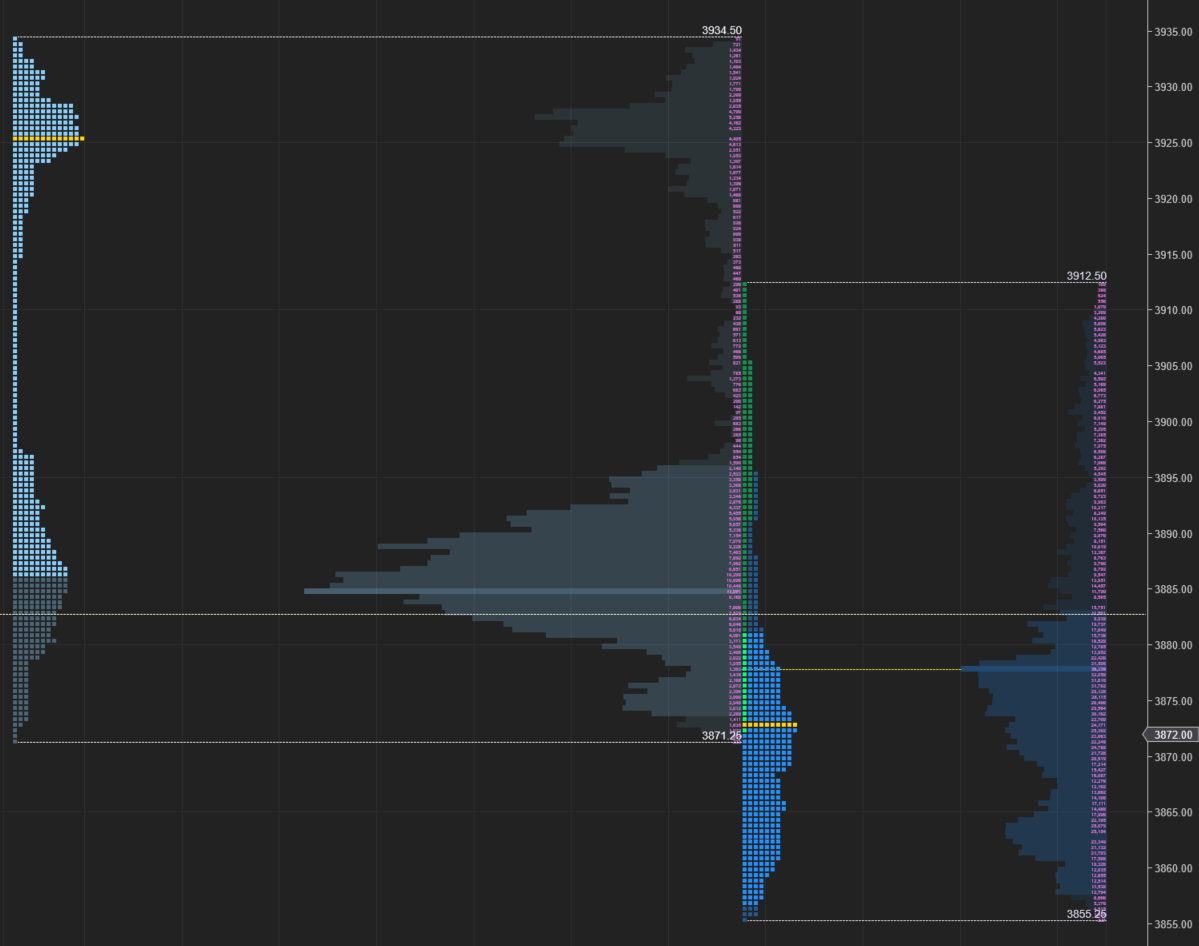
ES Market/Volume Profile Levels

RTH Weak High/Low: n/a
RTH Single Prints: n/a
RTH Excess: 3855.25 to 3855.75; 3905.50 to 3912.50
RTH Gap: n/a
Session Recap
Electronic Trading Hours (ETH)
Globex Session:
Wholesale was short at the prior day’s close. The overnight open was inside the prior day’s value area. Inventory was slightly long for the first half of Globex. However, buyers couldn’t lift ES above 3934.50. ES began to correct and once London open, supply sold off. Single prints were left on the way down between 3897 to 3915. ES fell underneath 3900. At 3871.25, shorts began to cover and their bid stabilized the auction. VPOC was 3884.75.
Range: 63.25
Regular Trading Hours (RTH)
US Session:
The RTH open gapped down and was beneath the prior day’s low and T+2 low. In A-period, ES rotated between a 20-point range and filled the overnight gap. In B and C-period, supply came and pushed the market down below VWAP for a drop of 40-handles before some short covering. After some back and forth, ES continued to slide once the bid was absorbed. The auction dipped below the overnight low. At 3855.25, a bid kept the auction from falling further. Sellers kept trying but eventually supply was turned off. Buyers came and lifted the offer as ES climbed 40-points and got back inside the overnight range. At 3895.50, buyers faded and responsive sellers moved the market nearly 30-points lower. The RTH session ended at 3872.
Range: 57.25