
12/13/2022 Synopsis
CPI was up 7.1% from a year ago, down 0.2% from a month ago. Every index finished green for the day, despite sliding down for most of it.

Market Overview

The major indices lost much of their morning gains but still managed to end in positive territory. The S&P 500 was up as much as 2.77% at its high for the day, but finished up 0.73% at the close. Consumer staples was the only S&P sector to finish with a loss. Real estate was the best performing sector, up 2.15%.
The yield on the 3-month bill gained 3 bps to 4.26%. The 2-year yield lost 15.7 bps to 4.23%. The 10-year yield slid 10.8% to 3.51%.
The US Dollar index $DXY dropped to 103.99, down 0.95%.
Crude oil ascended 2.85% to 75.39.
Here are some of today’s closing prices.

E-mini S&P 500 Top-Down Analysis

📈 Below are the monthly (5-years), weekly (2-years) and daily (6-months) charts for ES.

M/M: ES is OTFU from October to November. It will have two consecutive green months for the first time since summer 2021. ES also closed November above its 10-month MA for the first time since March.
W/W: ES ended OTFU on a weekly basis and closed back below it’s 40-week MA.
D/D: Post-CPI, the S&P rose above the larger balance area, but fell back inside. ES did manage to close back above the 200-day MA. It’s now 4 straight sessions where ES is OTFU and failed to trade beneath the previous day’s low.
E-mini S&P 500 Metrics
Recent Performance & Technicals


E-mini S&P 500 Volume/Market Profile
ES Composite Volume Profile (5 days)
📈 Here is a chart of the past five sessions with a composite ETH Volume Profile:

ES ETH/RTH Split Volume Profile (5 days)
📈 Here is a chart of the past five sessions with a daily ETH/RTH split Volume Profile:

ES ETH/RTH Split Market/Volume Profile (today)
📈 Here’s a TPO chart of today’s session with ETH/RTH split Market/Volume Profile:
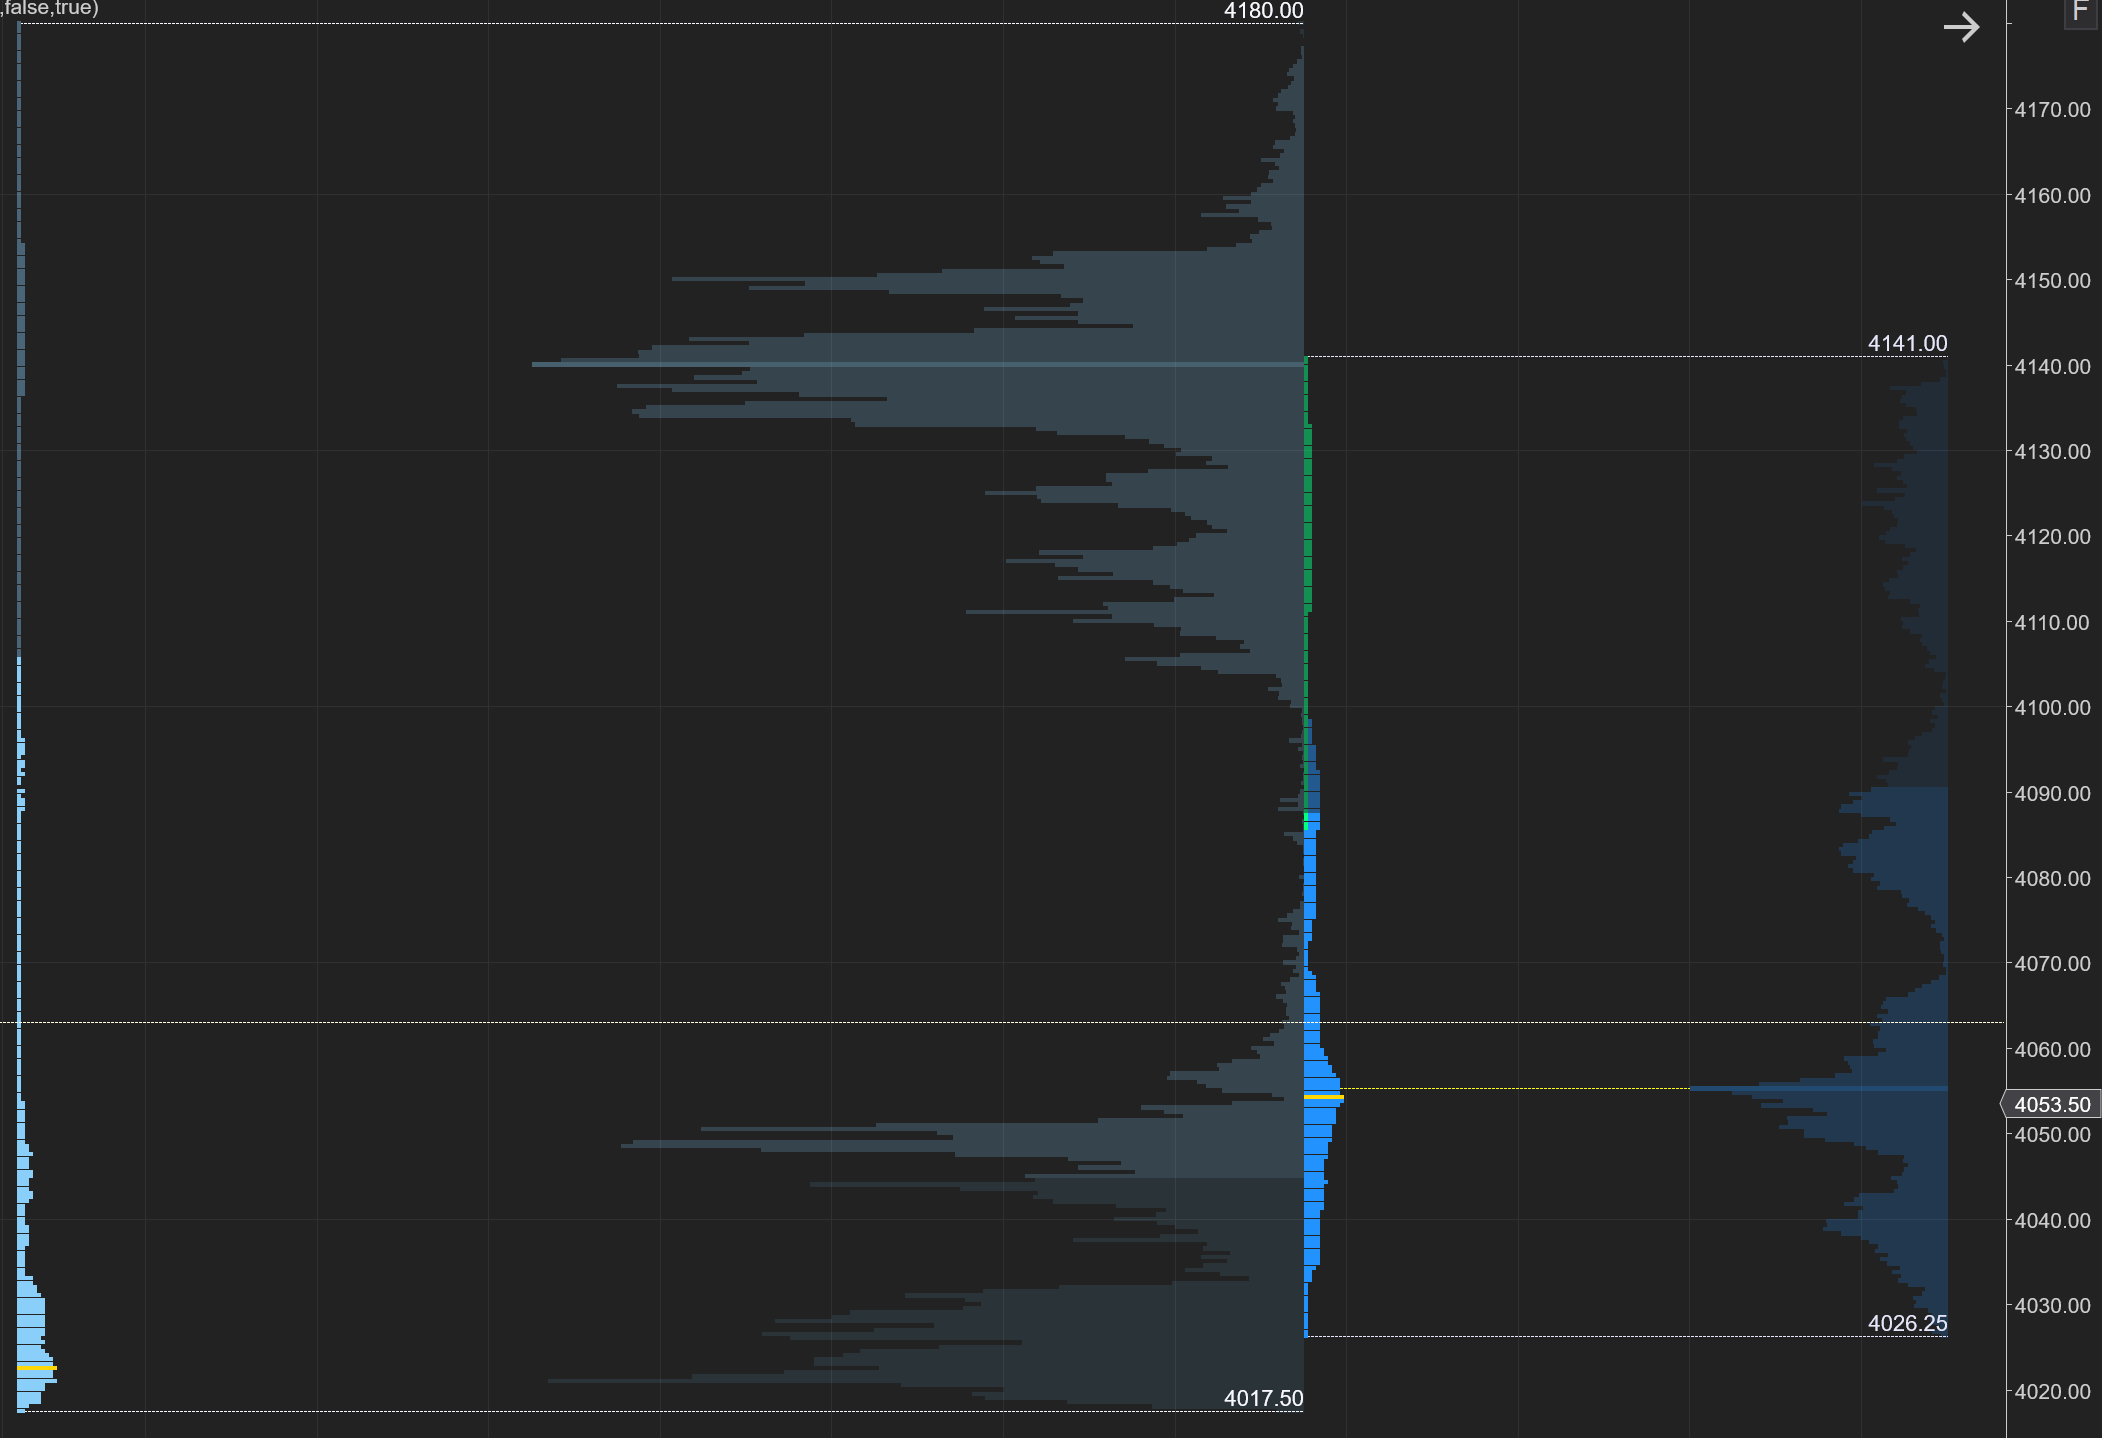
ES Market/Volume Profile Levels

RTH Weak High/Low: n/a
RTH Single Prints: 4068.75 to 4073; 4098.50 to 4111.25
RTH Excess: 4026.25 to 4033; 4133 to 4141
RTH Gap: 4026 to 4026.25
Session Recap
Electronic Trading Hours (ETH)
Globex Session:
Wholesale was long at the prior day’s close. The overnight open was above the prior day’s value area and inside the high of the day. Inventory during the overnight session was mostly long. ES fell below the prior day’s close by a few points, but failed to move below 4017.50. There wasn’t enough supply to get into the prior day’s single prints, where short traders were trapped. After a double bottom at 4017.50, the auction rotated up and surpassed the prior day’s high. ES continued making new overnight highs heading into the CPI announcement. When CPI came in lower than expected, ES shot up more than 100-points. At 4180, the offer failed to go higher and responsive sellers slowly pressured the market lower before RTH. Two sets of single prints were left in Globex, where short traders were trapped. VPOC was 4048.50.
Range: 162.50
Regular Trading Hours (RTH)
US Session:
The day session gapped up above the prior day’s high and T+2 high. There was a lack of demand in the opening hour, outside of short covering and responsive buying. ES fell roughly 60-handles in A and B-period to get underneath VWAP. Sellers absorbed the bid on the way down from the first set of overnight single prints. ES continued its descent following the initial balance period. Any responsive bids were absorbed as ES sank beneath the lower set of overnight single prints. In G-period, ES failed to lower the bid beneath 4026.25, one tick from the prior day’s high and several points from the overnight low. Shorts then covered and stabilized the auction. ES jumped by as much as 40-points off the low but traded sideways for the remainder of RTH.
Range: 114.75