
12/12/2022 Synopsis
Equities were up ahead of tomorrow's CPI print. The VIX gained 9.5% while the S&P 500 climbed 1.4%, an uncommon occurrence.

Market Overview

Here are the CPI numbers along with the S&P’s reaction going back to last November.

In rare fashion, the volatility index (VIX) climbed along with equities. Every index was positive, led by the Dow. Every S&P sector was green, with energy leading the way. Consumer discretionary was the worst sector, gaining 0.25%.
Short-duration Treasury yields fell. The rate on the 3-month bill dropped 1 basis point to 4.19%. The 2-year note gained 2.9 bps to 4.38%. The yield on the 10-year note ascended 2.9 bps to 3.61%.
The US Dollar index $DXY had a small gain of 0.06% to close at 104.99.
Crude oil popped 3.21% to 73.30.
Here are some of today’s closing prices.

E-mini S&P 500 Top-Down Analysis

📈 Below are the monthly (5-years), weekly (2-years) and daily (6-months) charts for ES.

M/M: ES is OTFU from October to November. It will have two consecutive green months for the first time since summer 2021. ES also closed November above its 10-month MA for the first time since March.
W/W: ES ended OTFU on a weekly basis and closed back below it’s 40-week MA.
D/D: ES is in balance inside a larger balance zone. Today’s close was just below the 10-day MA, with the 200-day MA a little further above.
E-mini S&P 500 Metrics
Recent Performance & Technicals


E-mini S&P 500 Volume/Market Profile
ES Composite Volume Profile (5 days)
📈 Here is a chart of the past five sessions with a composite ETH Volume Profile:
ES ETH/RTH Split Volume Profile (5 days)
📈 Here is a chart of the past five sessions with a daily ETH/RTH split Volume Profile:
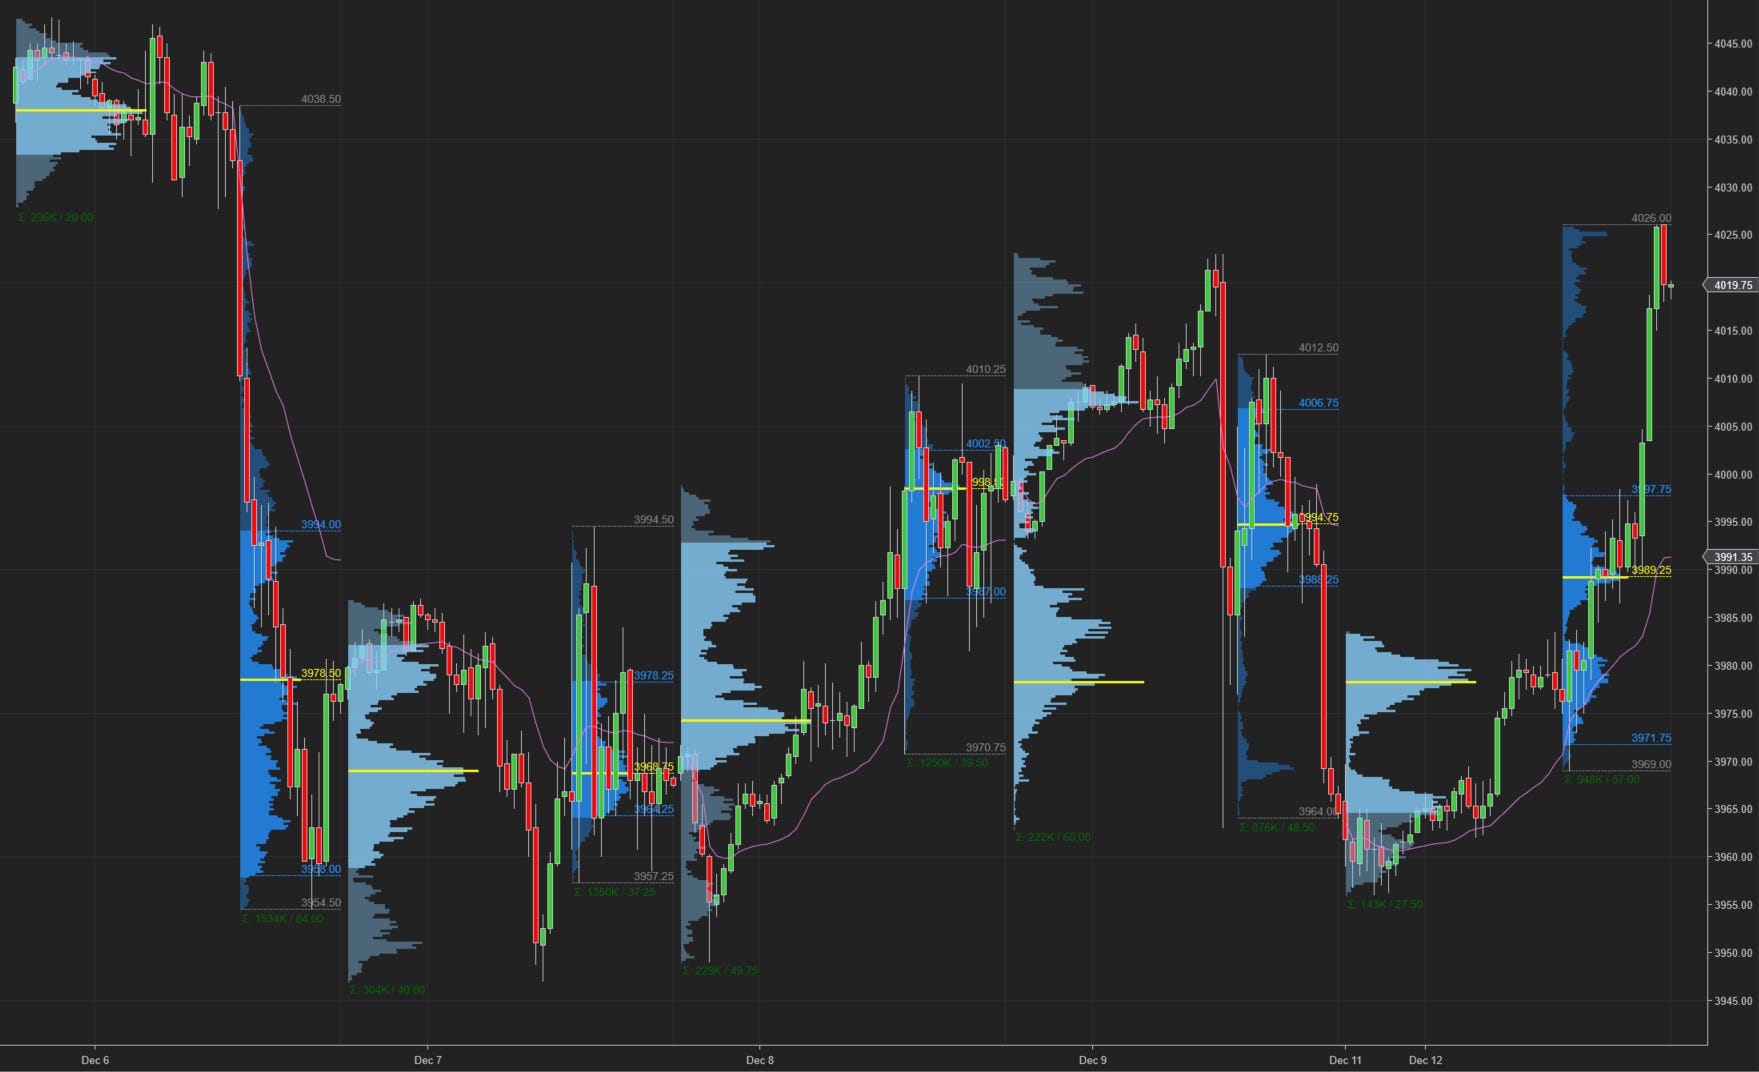
ES ETH/RTH Split Market/Volume Profile (today)
📈 Here’s a TPO chart of today’s session with ETH/RTH split Market/Volume Profile:
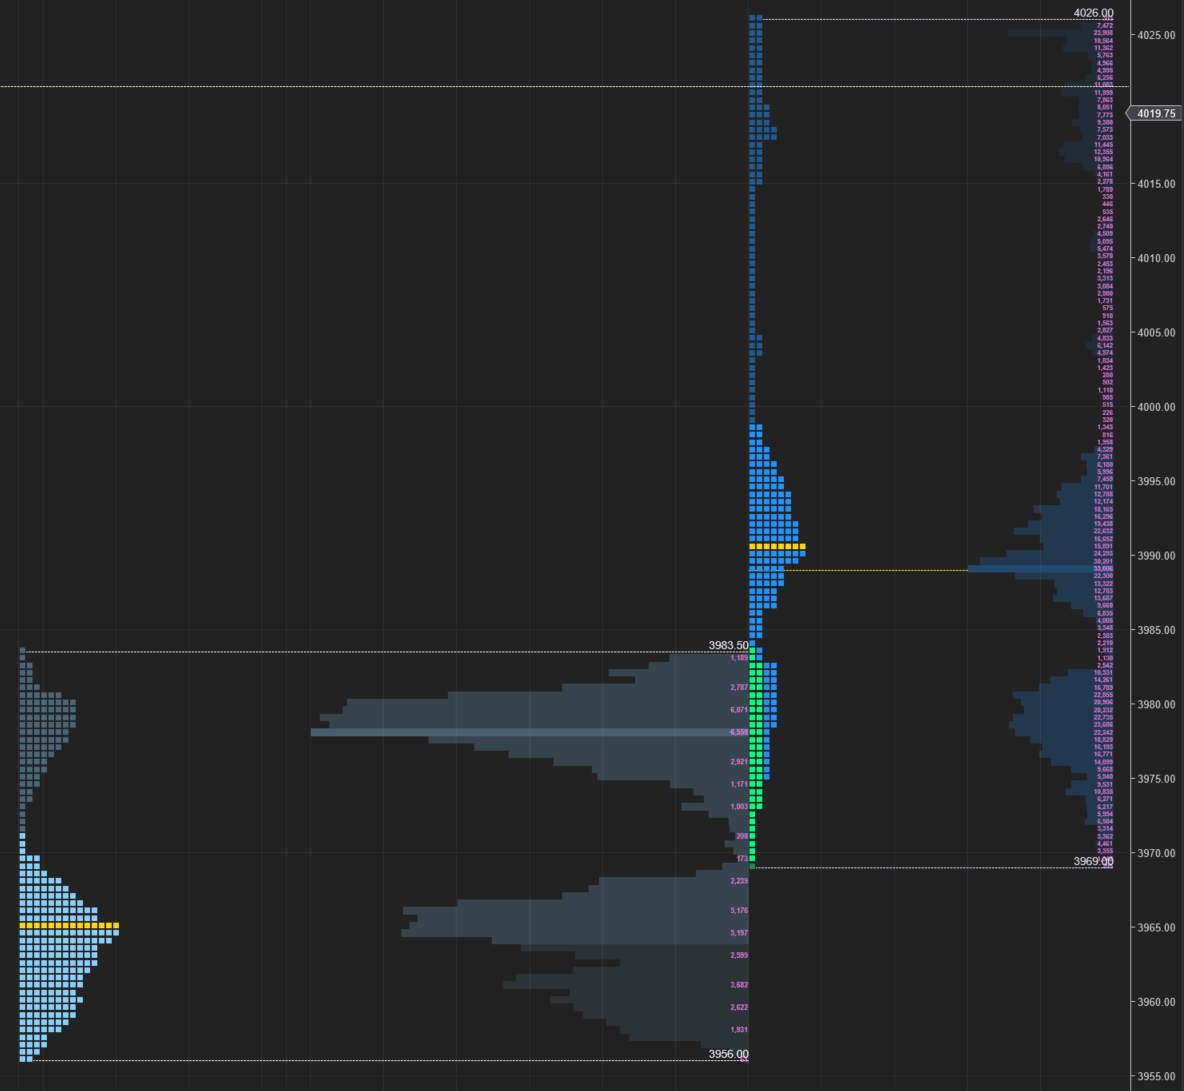
ES Market/Volume Profile Levels

RTH Weak High/Low: 4026 (high)
RTH Single Prints: 3998.50 to 4003.50; 4004.75 to 4015
RTH Excess: 3969 to 3973
RTH Gap: n/a
Session Recap
Electronic Trading Hours (ETH)
Globex Session:
Wholesale was short at the prior day’s close. The overnight open was a few points inside the prior day’s low. Short traders tried to sell the auction down during the first few hours of Globex. They took ES beneath the prior day’s low but were unable to decrease the bid at 3956, putting in a double low. ES rotated up as supply shut off. Long traders began to lift the offer and ES got back into the prior day’s range. About two hours into the London open, ES began to break out and hit new highs for the Globex session. At 3983.50, the Globex high, there was responsive selling right before RTH. VPOC was 3978.25 for the overnight session.
Range: 27.50
Regular Trading Hours (RTH)
US Session:
The RTH open was below the prior day’s value area and inside the T+2 range. At the open, sellers tried to take the market lower but there was no supply. Short traders failed to lower the bid below 3969. ES rotated back up and buyers were able to lift the offer on limited supply. In B-period, ES got above the overnight high by 1-tick before responsive sellers pushed the market lower. B-period failed to get below A-period’s low and this trend continued for until H-period. ES was OTFU from A through G-period as ES got back into the prior day’s value area. At 3998.50, there was a responsive seller that lowered ES by 12-handles. Once that seller was absorbed, buyers took ES to new session highs beginning in K-period. This began a 30-point rally that left two sets of single prints on the way up. The rally stalled at 4026, a few points over the 38.2 Fib level for the past 20-days.
Range: 57.00