
12/09/2022 Synopsis
Equities were down on Friday as wholesale prices rose 0.3% in November, more than anticipated.

Market Overview
Every index was down on Friday. The Russell fell the most while the Nasdaq and S&P held up the best, losing 0.70 and 0.73% each. Communications was the only S&P sector that was green. Energy fell the most, losing more than 2%.
US Treasury yields were all up. The rate on the 3-month climbed 3 bps to 4.20%. The 2-year yield rose 4 bps to 4.35%. The 10-year gained 9.8 bps to 3.58%.
The US Dollar index finished the week at 104.93, up 0.11% on the day.
Crude was down 0.62%, to close at a new YTD low of 71.02.
Events this week:

Here are some of Friday’s closing prices.

E-mini S&P 500 Top-Down Analysis

📈 Below are the monthly (5-years), weekly (2-years) and daily (6-months) charts for ES.

M/M: ES is OTFU from October to November. It will have two consecutive green months for the first time since summer 2021. ES also closed November above its 10-month MA for the first time since March.
W/W: ES ended OTFU on a weekly basis and closed back below it’s 40-week MA.
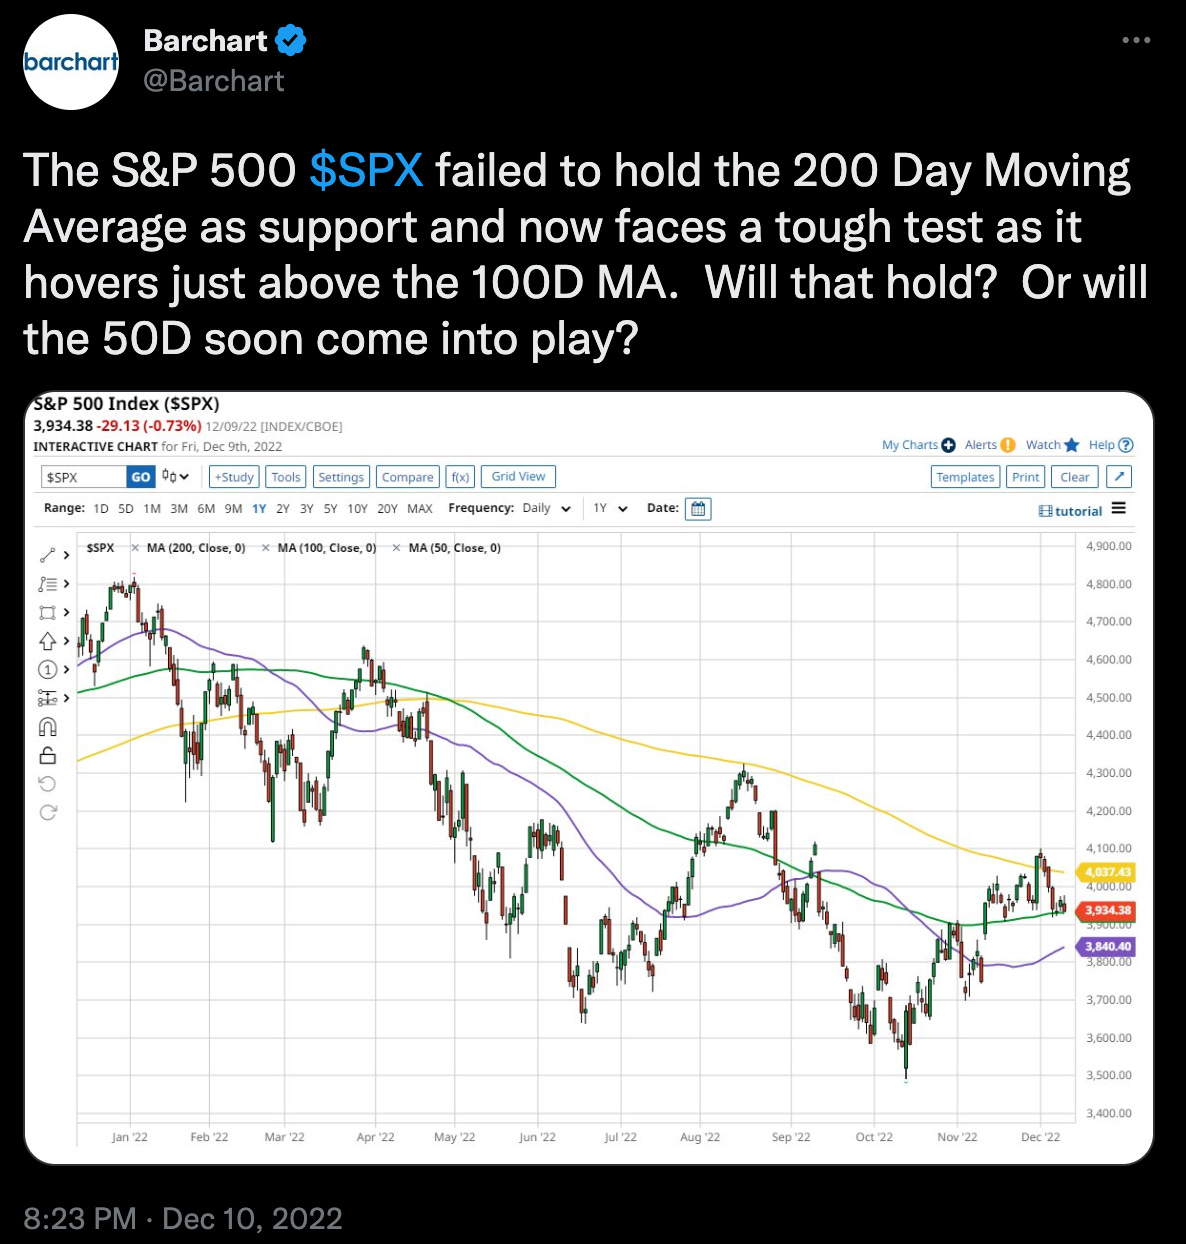
D/D: Despite falling 0.74%, ES failed to trade beneath the previous day’s low for the second straight session. It’s OTFU within a larger balance area (3912.50 to 4110).
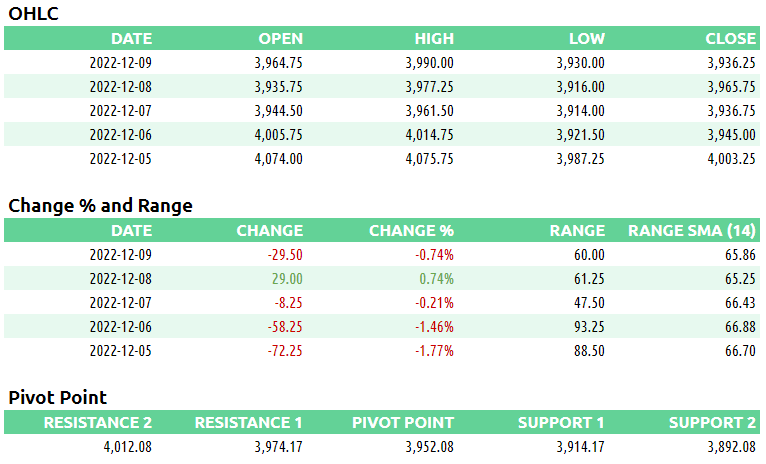
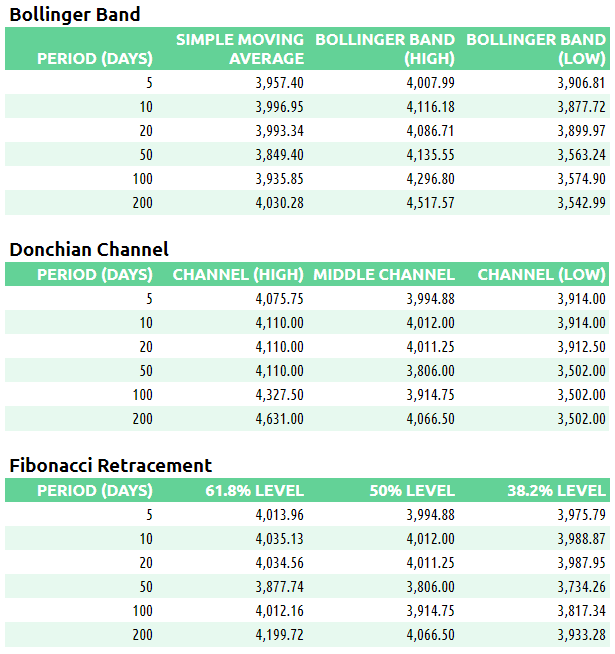
E-mini S&P 500 Metrics
Recent Performance & Technicals
E-mini S&P 500 Volume/Market Profile
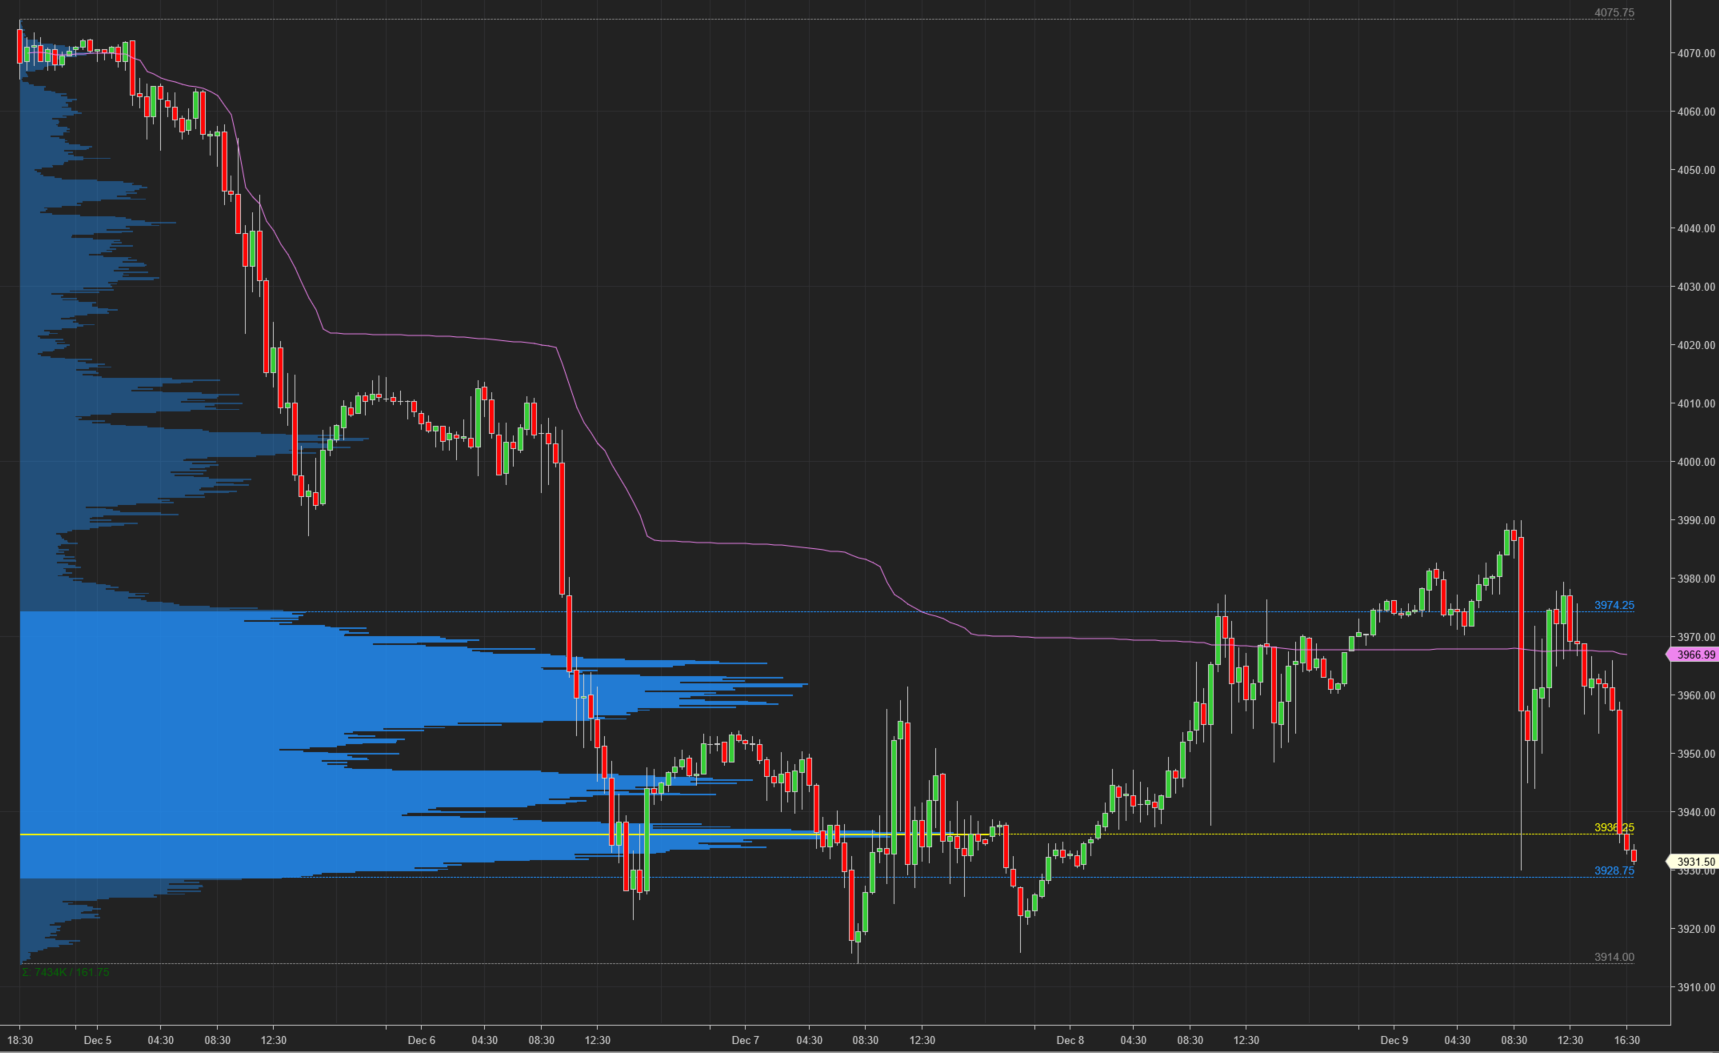
ES Composite Volume Profile (5 days)
📈 Here is a chart of the past five sessions with a composite ETH Volume Profile:
ES ETH/RTH Split Volume Profile (5 days)
📈 Here is a chart of the past five sessions with a daily ETH/RTH split Volume Profile:
ES ETH/RTH Split Market/Volume Profile (Friday)
📈 Here’s a TPO chart of Friday’s session with ETH/RTH split Market/Volume Profile:

ES Market/Volume Profile Levels

RTH Weak High/Low: n/a
RTH Single Prints: 3937.50 to 3944
RTH Excess: 3931 to 3932.75; 3978.25 to 3979.50
RTH Gap: n/a
Session Recap
Electronic Trading Hours (ETH)
Globex Session:
Wholesale was long at the prior day’s close. The overnight open was inside the prior day’s value area. The majority of the overnight session was long. Traders failed to lower the bid by double bottoming at 3960.25. From that point on, ES rotated up on lack of supply. ES eventually rose up above the prior day’s value area and high of the day. When the 8:30am PPI data was released, the bottom came out and ES fell 60-points. It fell below the prior day’s low of the day. At 3930, supply shut off and short covering caused a 30-point bounce before RTH. VPOC for Globex was 3945.
Range: 60
Regular Trading Hours (RTH)
US Session:
The RTH open was below the prior day’s value area and inside the T+2 range. The opening hour was volatile as price action whipped back and forth in a 30-handle range (3944 to 3972) between the +1 and -1 standard deviation. Supply above the range and trapped shorts below it prevented any follow through in either direction outside this range during A and B-period. In D-period, buyers lifted ES above the opening range. The auction rose above the prior day’s high by several points. At 3979.50, buyers failed to lift the offer as supply absorbed demand. Responsive sellers pressured ES lower, back into the prior day’s range, value area and Friday’s opening range. In the final 30-minutes of NYSE trading, ES dropped 25-points and fell beneath the opening range and prior day’s value area and low of the day. ES fell within a point of the overnight low before ending RTH at 3931.50.
Range: 48.50