
12/08/2022 Synopsis
Equity indexes were all positive while the S&P ended its losing streak at 5 days.

Market Overview

The S&P broke its 5-day losing streak. The Nasdaq-100 led the indices, gaining 1.13%. Nine S&P sectors were up, led by technology. Energy fared the worst of all sectors, losing 0.45%. If the S&P cannot close above 4026.14, it will end the week back below its 40-week MA.
US Treasury yields were mixed. The rate on the 3-month closed at 4.17%, up 3 bps. The 2-year gained 5.2 bps to 4.31%. The 10-year yield climbed 6.7% to 3.49%.
The US Dollar index $DXY slid to 104.81, down 0.35%.
Crude lost all of its early gains and ended the day down 0.76%, at 71.46.
Here are some of today’s closing prices.

E-mini S&P 500 Top-Down Analysis
📈 Below are the monthly (5-years), weekly (2-years) and daily (6-months) charts for ES.

M/M: ES is OTFU from October to November. It will have two consecutive green months for the first time since summer 2021. ES also closed November above its 10-month MA for the first time since March.
W/W: For the 4th week in a row, ES failed to trade beneath the low of the prior week as it continues to OTFU. This was also the first week since March that it closed above it’s 40-week MA.
D/D: ES ended OTFD at 4 sessions. It failed to break the previous day’s low but traded above the high.
E-mini S&P 500 Metrics
Recent Performance & Technicals


E-mini S&P 500 Volume/Market Profile
ES Composite Volume Profile (5 days)
📈 Here is a chart of the past five sessions with a composite ETH Volume Profile:
ES ETH/RTH Split Volume Profile (5 days)
📈 Here is a chart of the past five sessions with a daily ETH/RTH split Volume Profile:

ES ETH/RTH Split Market/Volume Profile (today)
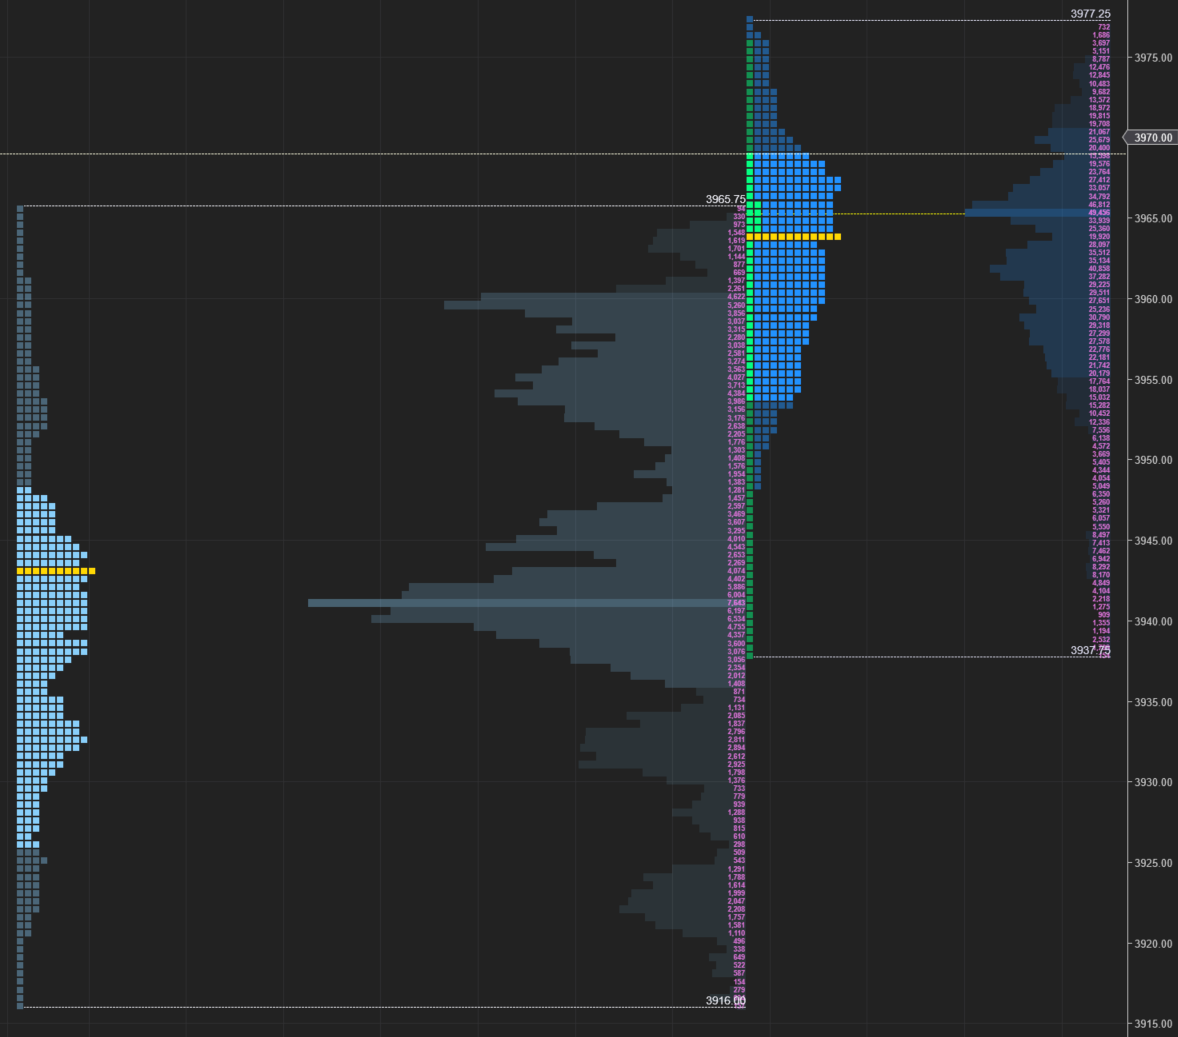
📈 Here’s a TPO chart of today’s session with ETH/RTH split Market/Volume Profile:
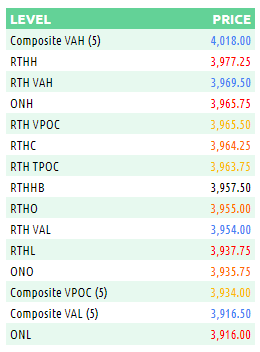
ES Market/Volume Profile Levels
RTH Weak High/Low: n/a
RTH Single Prints: n/a
RTH Excess: 3937.75 to 3948.50; 3976.50 to 3977.25
RTH Gap: n/a
Session Recap
Electronic Trading Hours (ETH)
Globex Session:
Wholesale was short at the prior day’s close. The overnight open was inside the prior day’s value area. Inventory was short to start Globex. Overnight supply failed to bring the auction below the previous day’s Globex low. At 3916, the bid held and ES rotated back up. Price action crossed VWAP and began making new overnight highs for the remainder of Globex. Going into RTH, buyers were able to lift ES above the prior day’s high. VPOC for Globex was 3941.25.
Range: 49.75
Regular Trading Hours (RTH)
US Session:
The RTH open was above the prior day’s value area and inside the T+2 range. At the US open, there was an inventory correction of about 15-points that moved the auction down below VWAP. ES couldn’t remain as supply dwindled and buyers hit the offer to cause a 30-point rally. ES kept moving up in the first hour of trading and rose above the overnight high. Buyers failed to lift the offer over 3977.25, which ended up being the RTH high, during C-period. ES traded back and forth in a range from 3948.50 to 3976.50 for the remainder of the day. ES ended RTH at 3964.25.
Range: 39.50