
12/05/2022 Synopsis
Stocks fall for a 3rd straight session as the S&P 500 closes back below its 200-day MA.

Market Overview
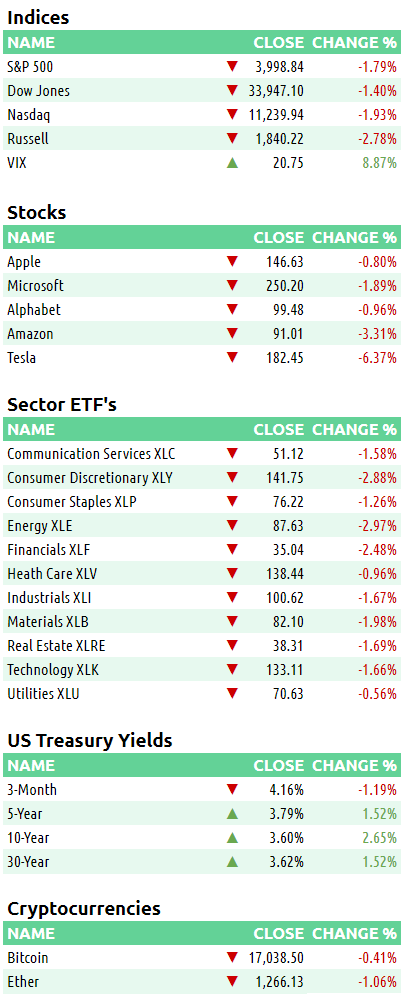
Every index lost more than 1%, with the Russell 2000 getting hit the hardest. The Dow stood up the best, only losing -1.40%. Every S&P sector fell with energy sliding the most. Utilities was the best performing sector with a loss of -0.56%. With today’s drop, the S&P 500 closed back below the 200-day MA.
Treasury yields were mostly green today. The yield on the 3-month bill was an outlier, falling 2 bps to 4.19%. The 2-year was up 11.3 bps to 4.39%. The 10-year gained 8.7 bps to 3.58%.
The US Dollar index $DXY rose +0.75% to 105.29.
Crude was deep in the red, losing -3.81% to 76.93.
Here are some of today’s closing prices.
E-mini S&P 500 Top-Down Analysis

📈 Below are the monthly (5-years), weekly (2-years) and daily (6-months) charts for ES.

M/M: ES is OTFU from October to November. It will have two consecutive green months for the first time since summer 2021. ES also closed November above its 10-month MA for the first time since March.
W/W: For the 4th week in a row, ES failed to trade beneath the low of the prior week as it continues to OTFU. This was also the first week since March that it closed above it’s 40-week MA.
D/D: For the 2nd day in a row, ES failed to trade above the previous day’s high. ES is OTFD.
E-mini S&P 500 Metrics
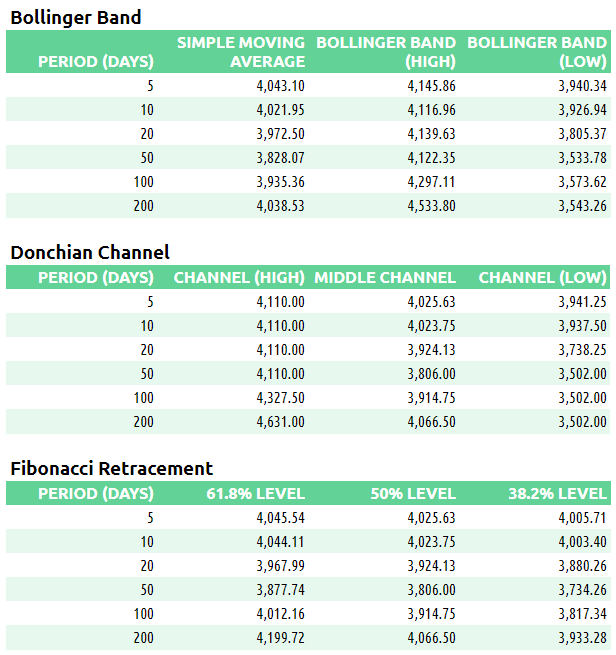
Recent Performance & Technicals

E-mini S&P 500 Volume/Market Profile
ES Composite Volume Profile (5 days)
📈 Here is a chart of the past five sessions with a composite ETH Volume Profile:

ES ETH/RTH Split Volume Profile (5 days)
📈 Here is a chart of the past five sessions with a daily ETH/RTH split Volume Profile:

ES ETH/RTH Split Market/Volume Profile (today)
📈 Here’s a TPO chart of today’s session with ETH/RTH split Market/Volume Profile:

ES Market/Volume Profile Levels

RTH Weak High/Low: n/a
RTH Single Prints: n/a
RTH Excess: 3987.25 to 3991.75; 4045.75 to 4055.50
RTH Gap: n/a
Session Recap
Electronic Trading Hours (ETH)
Globex Session:
Wholesale was short at the prior day’s close. The overnight open was inside the prior day’s value area. Inventory during Globex was mixed. It started off slightly long over Friday’s close. However, going into the London open, inventory got short. Most of the price action was contained inside of the previous day’s value area. There was supply above 4075.75. Heading into RTH, ES was making new lows for the session. VPOC was 4070.
Range: 31.75
Regular Trading Hours (RTH)
US Session:
The RTH open was right at Friday’s VAL and underneath the T+2 low. At the open, long traders tried to lift the auction and got 1-point above the T+2 low before running into supply. At 4055.50, buyers could no longer lift the offer. ES rotated down and dipped underneath the overnight low and and previous day’s low. At 4022, there was some short covering but once this buying ended, supply pressured the market lower. At 3987.25, ES finally found a bid and that ended the descent. Short covering ensued through the remainder of RTH, where the session ended at 4006.25.
Range: 68.25