
12/02/2022 Synopsis
There were more jobs added in November than expected, which sent the S&P 500 downhill.

Market Overview

Equities were mixed on Friday. The Russell 2000 and the Nasdaq registered small gains while the Dow and S&P 500 logged small losses. The VIX closed under 20. Five S&P sectors were up as materials led the way. Energy was the worst performing sector. Although the S&P fell for the final two days of the week last week, it managed to close above its 200-day MA for three consecutive days.
Near-term US treasury yields were up while longer duration rates were down. The 3-month was flat at 4.21%. The 2-year yield gained 4.4 bps to 4.28%. The 10-year yield slid 2.2 bps to 3.49%.
The US Dollar index $DXY lost -0.22% to 104.50.
Crude fell -1.53% to 79.98.
Events this week:

Here are some of Friday’s closing prices.

E-mini S&P 500 Top-Down Analysis

📈 Below are the monthly (5-years), weekly (2-years) and daily (6-months) charts for ES.

M/M: ES is OTFU from October to November. It will have two consecutive green months for the first time since summer 2021. ES also closed November above its 10-month MA for the first time since March.
W/W: For the 4th week in a row, ES failed to trade beneath the low of the prior week as it continues to OTFU. This was also the first week since March that it closed above it’s 40-week MA.
D/D: ES was down as much as 0.9%. It recovered the losses to still close slightly red but above the 200-day MA for the 2nd straight day. ES is OTFU.
E-mini S&P 500 Metrics
Recent Performance & Technicals


E-mini S&P 500 Volume/Market Profile
ES Composite Volume Profile (5 days)
📈 Here is a chart of the past five sessions with a composite ETH Volume Profile:

ES ETH/RTH Split Volume Profile (5 days)
📈 Here is a chart of the past five sessions with a daily ETH/RTH split Volume Profile:

ES ETH/RTH Split Market/Volume Profile (Friday)
📈 Here’s a TPO chart of Friday’s session with ETH/RTH split Market/Volume Profile:
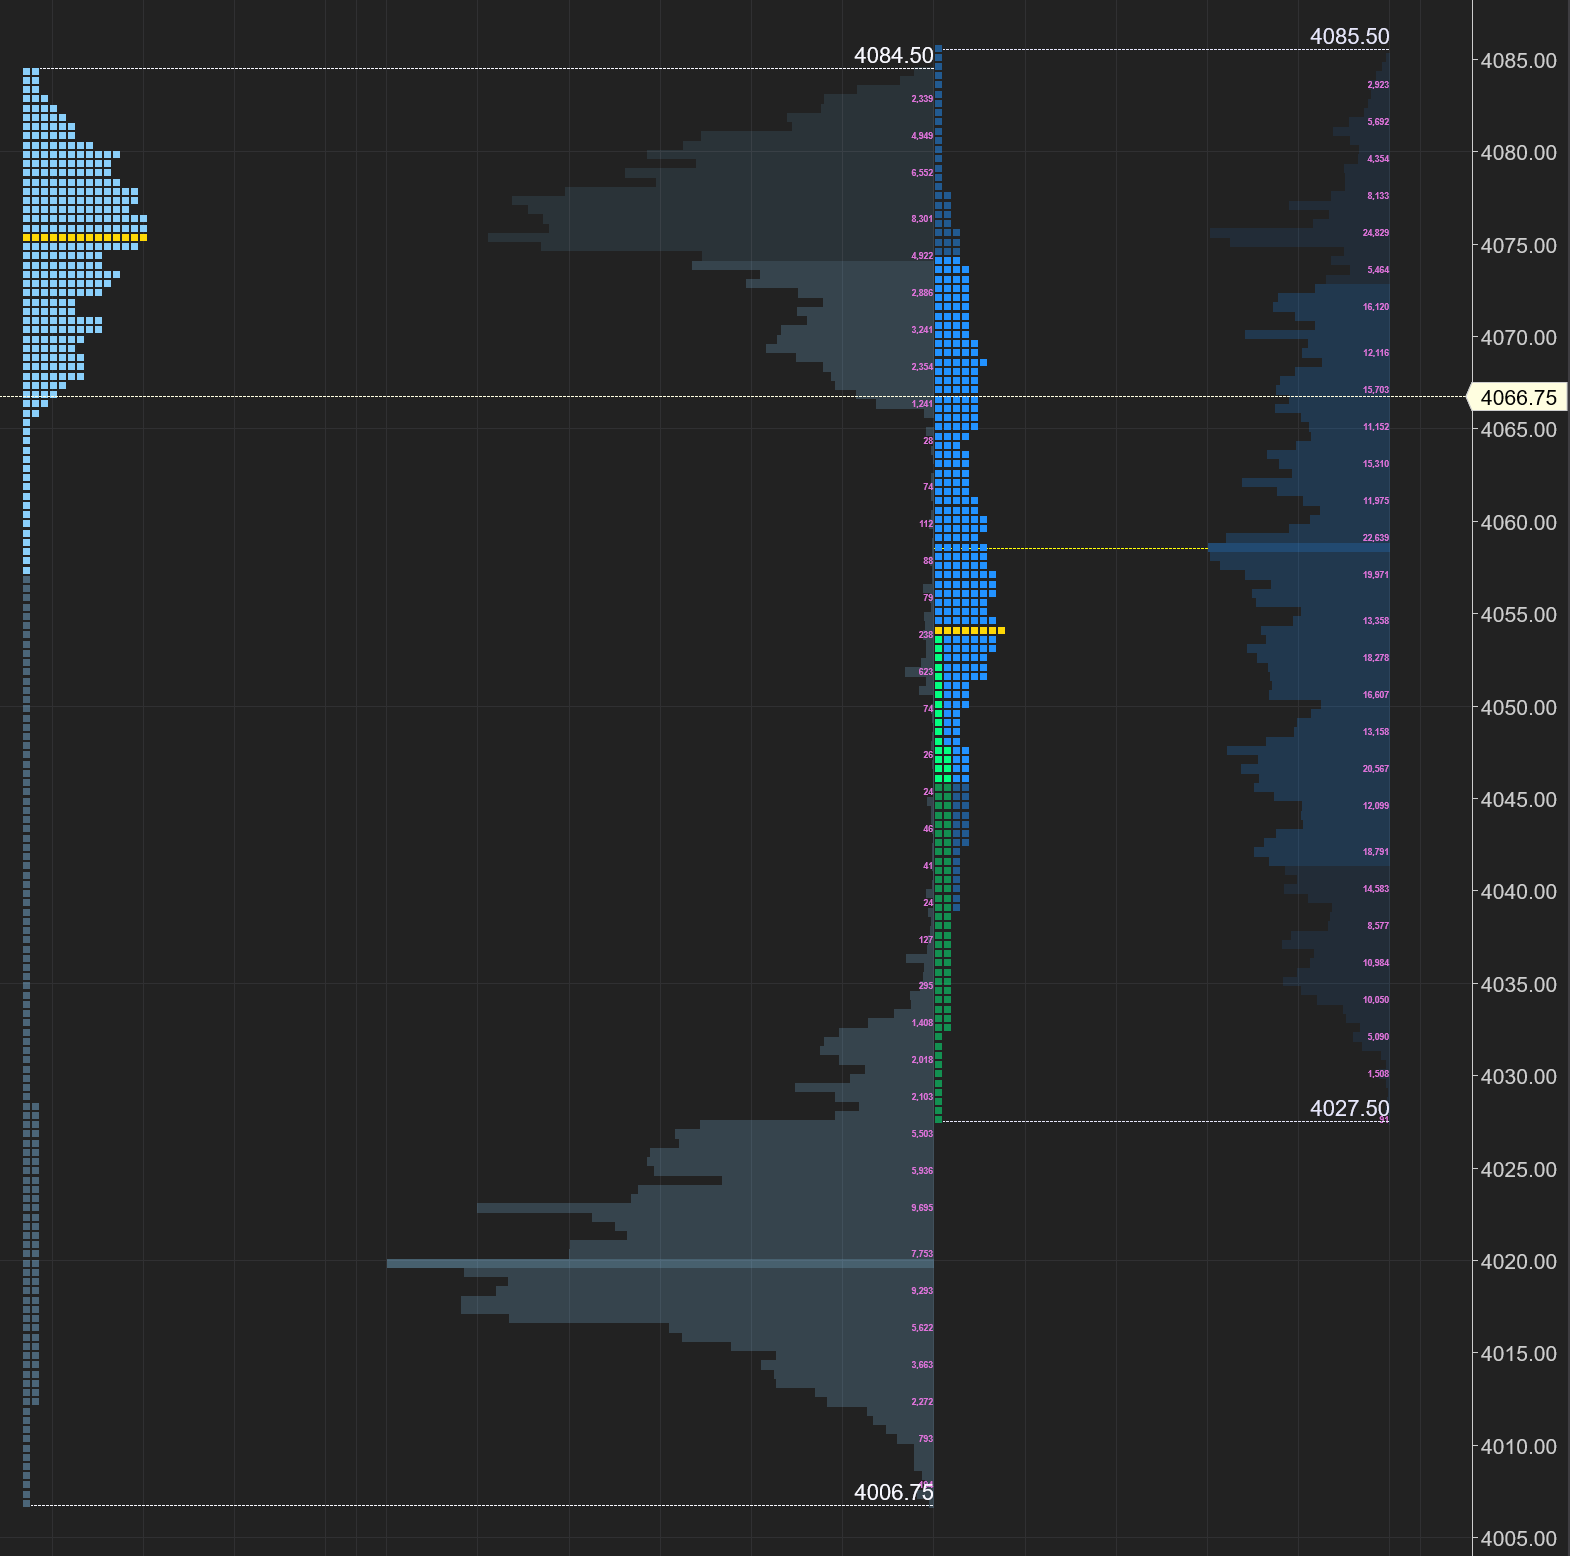
ES Market/Volume Profile Levels

RTH Weak High/Low: n/a
RTH Single Prints: n/a
RTH Excess: 4027.50 to 4032.75; 4077.75 to 4085.50
RTH Gap: n/a
Session Recap
Electronic Trading Hours (ETH)
Globex Session:
Wholesale was short at the prior day’s close. The overnight open was inside the prior day’s value area. Inventory during Globex was flat and rotational inside a 20-point range. All of the price action was contained inside the prior day’s range. When the non-farm payroll figures for November were released at 8:30am EST, the bottom fell out and ES fell 70-points. The drop took ES well beneath Thursday’s low and left only the bottom set of single prints from Wednesday’s move up. Supply ran out and couldn’t take the bid beneath 4006.75. Longs were trapped on the sharp move to the downside. VPOC during Globex was at 4020.
Range: 77.75
Regular Trading Hours (RTH)
US Session:
The RTH open gapped down and was below the prior day’s low but inside the T+2 range. Short covering was carrying over from Globex as buyers were able to chew through the overhead supply left from the overnight session. Any responsive sellers were absorbed as ES was OTFU in the first 6 TPO-periods to close the RTH gap and get above VWAP. At 4070, there was a responsive seller and longs couldn’t lift the offer. ES slipped 20-handles to 4050, but shorts couldn’t move ES below VWAP. The selling faded and longs lifted ES into the previous day’s value area and filled the single prints from the drop in Globex. Buyers took the auction above the overnight high by a few ticks but couldn’t take the offer above 4085.50. Supply pushed ES lower by 20-points and RTH ended at 4066.75.
Range: 58