
12/01/2022 Synopsis
Equities were mixed a day after the market reacted positive to Fed Chair Powell's remarks. Core PCE, the Fed's preferred measure of inflation, came in below analyst estimates for October.

Market Overview
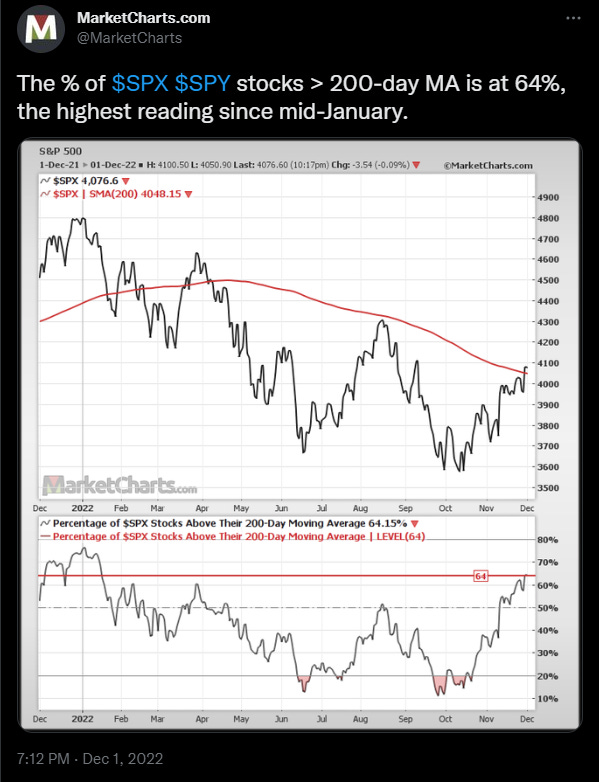
The S&P, Dow and Russell all fell. The Dow was hit the hardest losing -0.56%. The Nasdaq finished green, gaining +0.13%. Five S&P sectors were positive on the day, led by communications services. Financials slid -0.58%, outpacing the losers. The S&P 500, despite the loss, managed to close above the 200-day MA for the 2nd day in a row.
The yield on the 3-month bill fell 4 bps to 4.21%. The 2-year note lost 8.2 bps to 4.23%. The 10-year note lost 10 bps 3.51%. The 10-year’s yield is now down 17% over the last 6-weeks.
The US Dollar index fell to 104.73, its lowest close since August. It’s down 8.2% over the last two months.
Crude oil gained +1.07% to 81.41.
Here are some of today’s closing prices.

E-mini S&P 500 Top-Down Analysis

📈 Below are the monthly (5-years), weekly (2-years) and daily (6-months) charts for ES.

M/M: ES is OTFU from October to November. It will have two consecutive green months for the first time since summer 2021. ES also closed November above its 10-month MA for the first time since March.
W/W: ES had an inside week as all the trading on the short Thanksgiving week was contained inside the prior week’s range. ES is also still OTFU.
D/D: ES was down as much as 0.9%. It recovered the losses to still close slightly red but above the 200-day MA for the 2nd straight day. ES is OTFU.
E-mini S&P 500 Metrics
Recent Performance & Technicals


E-mini S&P 500 Volume/Market Profile
ES Composite Volume Profile (5 days)
📈 Here is a chart of the past five sessions with a composite ETH Volume Profile:

ES ETH/RTH Split Volume Profile (5 days)
📈 Here is a chart of the past five sessions with a daily ETH/RTH split Volume Profile:

ES ETH/RTH Split Market/Volume Profile (today)
📈 Here’s a TPO chart of today’s session with ETH/RTH split Market/Volume Profile:

ES Market/Volume Profile Levels

RTH Weak High/Low: n/a
RTH Single Prints: n/a
RTH Excess: 4054.50 to 4057.75; 4104.75 to 4110
RTH Gap: n/a
Session Recap
Electronic Trading Hours (ETH)
Globex Session:
Wholesale was long at the prior day’s close. The overnight open ticked up and was slightly above the prior day’s range. During the Japan open, ES immediately fell back into yesterday’s range and value area. Inventory was mostly short and price action rotated inside a 30-point range. There was no follow through on the short side as traders couldn’t move ES beneath 4072. This resulted in a push to the upside as buyers lifted the offer, bringing inventory long prior to RTH.
Range: 32.75
Regular Trading Hours (RTH)
US Session:
The RTH open gapped up and was a few points above the previous day’s high. It was also above the T+2 high. Sellers closed the gap in A-period but couldn’t get beneath VWAP. ES rotated back up to the +2 standard deviation. After failing to raise the offer above 4110, and the +3 standard deviation, sellers dumped ES. The market slid down 50-handles in B-period with no bid in sight. Supply shut off after failing to lower the bid at 4054.50, inside the 3rd set of single prints from the prior day. Short covering began and ES rallied 30-points while failing to get over VWAP. ES was in balance and traded sideways for the remainder of RTH inside a range from about the -1.5 standard deviation to the +1 standard deviation.
Range: 55.50
Links
The Fed’s preferred inflation measure, core PCE, rose by 0.2% in October. This was below analyst estimates.