
11/29/2022 Synopsis
The S&P Case Shiller home price index fell for the third straight month. Equities were mixed ahead of tomorrow's mix of economic data points and Fed speakers.

Market Overview

Equities were mixed as the S&P and Nasdaq were red, while the Russell and Dow were slightly green. This was the 3rd straight losing session for the S&P. It remains stuck in a balance area (3906.54 to 4034.02) for the 12th day in a row. Five S&P sectors were up on the day, led by real estate. Technology was the worst performing sector.
Interest rates all rose. The yield on the 3-month T-bill moved 6 bps to 4.27. The 2-year note climbed 3.5 bps to 4.48%. The 10-year note gained 6.5 bps to 3.75%.
The US Dollar index $DXY erased early losses and climbed for a +0.16% gain to end the day at 106.84.
Crude oil lost some of its gains but still finished up +1.24% to 78.20.
Here are some of today’s closing prices.

E-mini S&P 500 Top-Down Analysis

📈 Below are the monthly (5-years), weekly (2-years) and daily (6-months) charts for ES.

M/M: As long as ES remains above 3502, it will be OTFU. September’s high at 4175 is the next upside target.
W/W: ES had an inside week as all the trading on the short Thanksgiving week was contained inside the prior week’s range. ES is also still OTFU.
D/D: For the 2nd day in a row, the prior day’s high wasn’t exceeded. ES continues to OTFD. In addition, it’s now 12 straight sessions in balance between 3912.50 and 4050.75.
E-mini S&P 500 Metrics
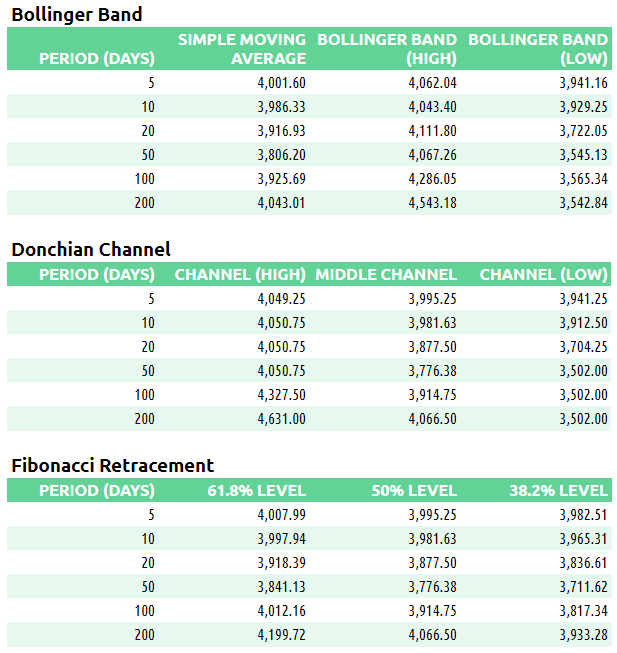
Recent Performance & Technicals

E-mini S&P 500 Volume/Market Profile
ES Composite Volume Profile (5 days)
📈 Here is a chart of the past five sessions with a composite ETH Volume Profile:

ES ETH/RTH Split Volume Profile (5 days)
📈 Here is a chart of the past five sessions with a daily ETH/RTH split Volume Profile:

ES ETH/RTH Split Market/Volume Profile (today)
📈 Here’s a TPO chart of today’s session with ETH/RTH split Market/Volume Profile:

ES Market/Volume Profile Levels

RTH Weak High/Low: n/a
RTH Single Prints: n/a
RTH Excess: 3941.25 to 3943.25; 3979 to 3981.75
RTH Gap: 4017.75 to 4025.25 (11/28/22)
Session Recap
Electronic Trading Hours (ETH)
Globex Session:
Wholesale was short at the prior day’s close. The overnight open was inside the prior day’s value area. Inventory during Globex was nearly 100% long. Trapped shorts held the market above 3969.25 during the initial hours of the Japan open. Large traders were able to take advantage and distribute inventory above VWAP. Longs were unable to lift ES above 3990.25. Supply applied pressure on the market as it crept lower after London opened. ES eventually fell beneath VWAP and also took out the lows from the Japan open. ES was making new overnight lows heading into RTH. VPOC for Globex was up at 3983.
Range: 24.25
Regular Trading Hours (RTH)
US Session:
The RTH open was inside of the previous day’s value area and below the T+2 low. Longs failed to lift ES above VWAP during A-period as it rotated in a 15-points range. There was a lack of supply in B and early C-period as buyers were able to accept above VWAP. They couldn’t lift the offer above 3981.75, which was near the pivot point and 10-day 50% Fib level. As buyers scattered here, supply moved the auction down towards VWAP again. In D-period, ES stumbled 30-points and trapped longs on the way down. Sellers failed to lower the bid below 3941.25 as they cut supply. Shorts covered here and ES stabilized. The remainder of RTH was uneventful as the price action moved in an ascending channel with roughly 15-points of chop. Much of the action remained below VWAP the remainder of the day as volatility dried up later in the afternoon. ES ended RTH at 3962.25, a few points shy of the 38.2% 10-day Fib level.
Range: 40.50