11/28/2022 Synopsis
The VIX gapped up while the S&P 500 gapped down and fell -1.5%. on the day Crypto lender, BlockFi, filed for Chapter 11.
Market Overview
Every equity index lost more than 1% to begin the post-Thanksgiving week. The Russell (-2.05%) had the worst performance of the day while the Dow (-1.45%) had the best. The S&P 500 gapped down and fell further away from its 200-day MA. Every S&P sector was red led by real estate on the way down. Consumer staples held up the best only losing -0.38%.
The 3-month T-bill gained a basis point to close at 4.21%. The 2-year lost 2.3 bps, falling to 4.44%. The 10-year slid 0.8 bps down to 3.68%.
The US Dollar index rose +0.57% to 106.67. $DXY appears to be bouncing off its 200-day MA.
Crude oil gained +1.26% to finish at 77.24.
Events this week:
Here are some of today’s closing prices.
E-mini S&P 500 Top-Down Analysis
📈 Below are the monthly (5-years), weekly (2-years) and daily (6-months) charts for ES.
M/M: As long as ES remains above 3502, it will be OTFU. September’s high at 4175 is the next upside target.
W/W: ES is OTFU as it remained above the prior week’s low for the second straight week. ES broke out above the prior week’s high but failed to remain as it closed inside last week’s close.
D/D: ES failed to take out the Friday high and is beginning to OTFD. The past 11 sessions have been in balance and rotational between 3912.50 and 4050.75.
E-mini S&P 500 Metrics
Recent Performance & Technicals
E-mini S&P 500 Volume/Market Profile
ES Composite Volume Profile (5 days)
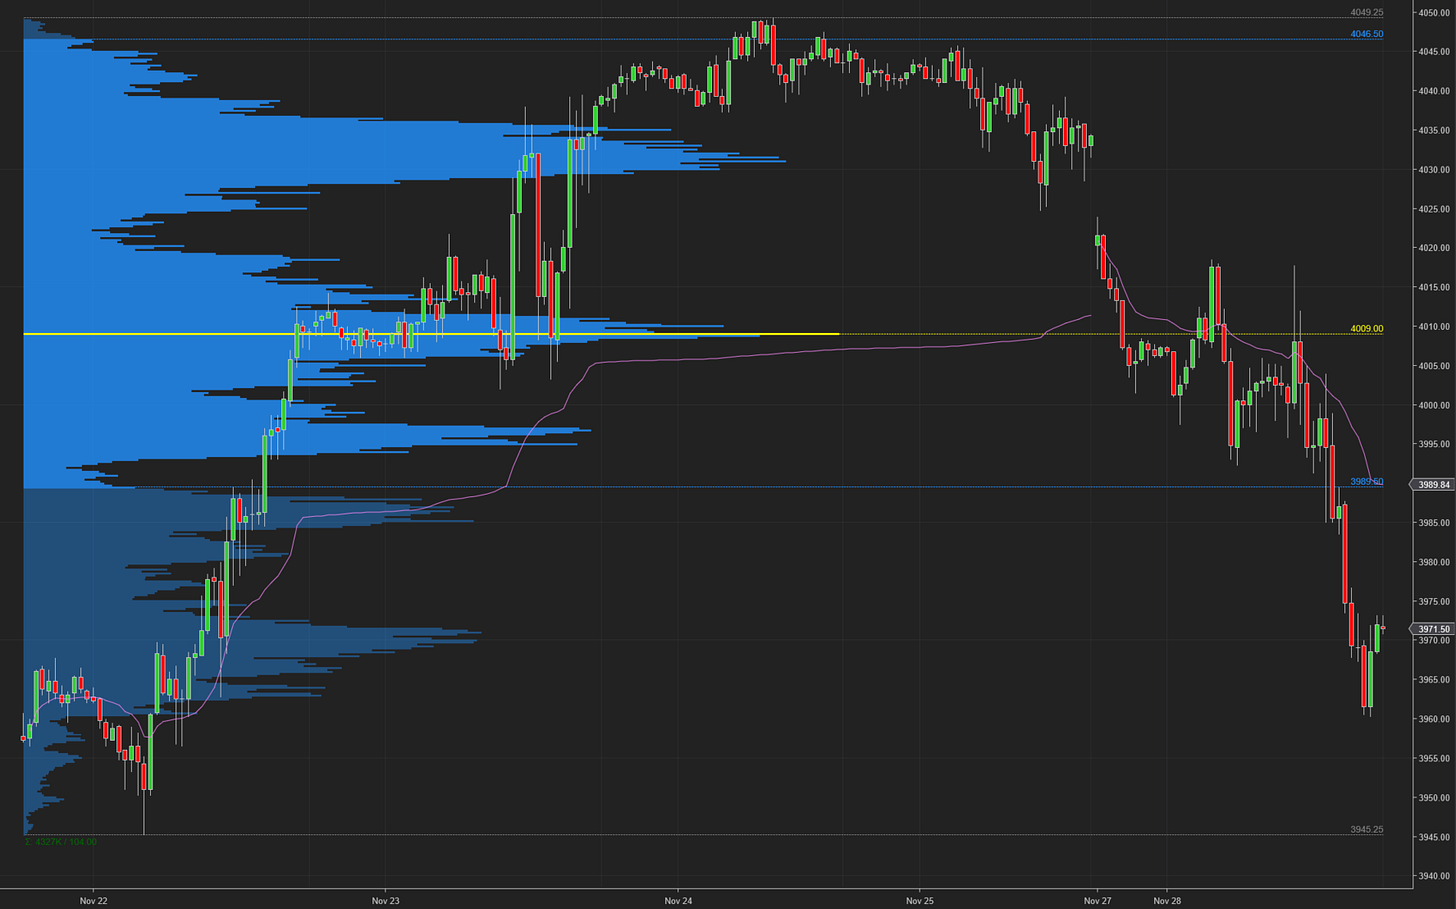
📈 Here is a chart of the past five sessions with a composite ETH Volume Profile:
ES ETH/RTH Split Volume Profile (5 days)
📈 Here is a chart of the past five sessions with a daily ETH/RTH split Volume Profile:
ES ETH/RTH Split Market/Volume Profile (today)
📈 Here’s a TPO chart of today’s session with ETH/RTH split Market/Volume Profile:
ES Market/Volume Profile Levels
RTH Weak High/Low: 3960.25 (low)
RTH Single Prints: 3976.75 to 3983.50
RTH Excess: 4012 to 4017.75
RTH Gap: 4017.75 to 4025.25
Session Recap
Electronic Trading Hours (ETH)
Globex Session:
The market was open on Friday for a 1/2 day. That overnight session opened up a tick inside of Wednesday’s value area. It exceeded Wednesday’s high and remained there for a significant amount of time. Buyers failed to elevate the offer beyond 4045.75. Selling pressure moved ES back into the prior day’s value area. Bids were eventually hit and ES was OTFD as the auction moved lower. At 4025.25, supply shut off and ES stabilized to close RTH at 4034.25 on Friday, a couple of points above Wednesday’s VPOC. Wholesale was short at Friday’s close.
Today’s overnight session gapped down and opened below Friday’s range, and Wednesday’s value area. Inventory was 100% short below the prior day’s close and Wednesday’s value area. The offer couldn’t be lifted above 4024 as the overnight gap failed to fill. ES moved lower as sellers searched for buyers. ES broke 4000, but failed to fall below 3992.25. Short covering stabilized ES in this area and the November 22nd single prints held up.
Range: 31.75
Regular Trading Hours (RTH)
US Session:
The RTH open gapped down and was 20-points beneath Friday’s low and a few ticks below the T+2 low. Inventory during Globex was massively short so it corrected in the opening half hour, or A-period. The T+2 gap closed and the overnight gap was not completely filled. Buyers couldn’t retest the overnight high as supply was met at the +2 standard deviation level. From there, sellers put pressure and ES rotated down falling underneath VWAP. There were some buyers near the overnight low but they were eventually absorbed and ES continued to drop. There were single prints in I-period, indicating trapped short sellers. After falling underneath the November 22nd low, aggressive sellers couldn’t take out the bid at 3960.25. Short covering prevented any further descent and RTH closed at 3971.50.
Range: 57.50


