
11/23/2022 Synopsis
Stocks tick higher as several economic data points were released. Minutes from the Fed's last FOMC meeting show their base case is to throw the economy into a recession.

Market Overview

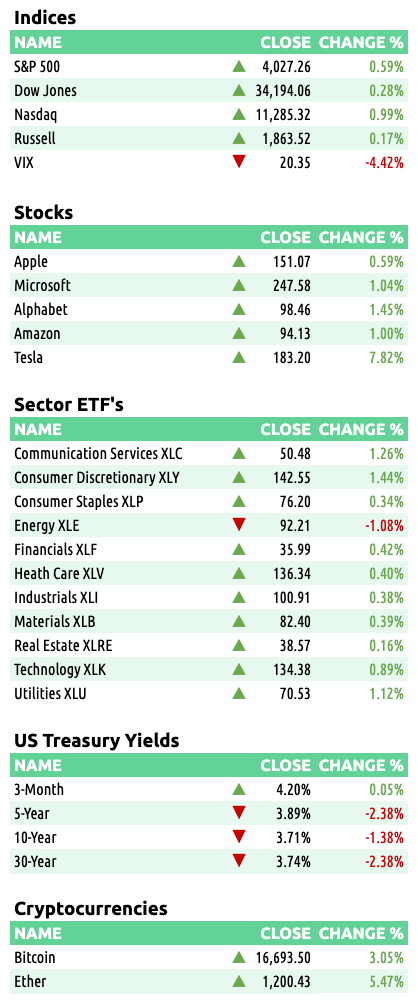
Stock indices rose again with the Nasdaq and S&P leading the way. The S&P 500 is now 0.79% from its 200-day MA. Ten S&P sectors were green today led by consumer discretionary (+1.44%). Energy was down -1.08% and was the only sector in the red.
The 3-month bill rose 1 bp to 4.21%. The 2-year note slid 3 bps to 4.49%. The 10-year lost 6 bps to close at 3.70%.
The US Dollar index $DXY lost -0.98% to end the day at 106.09.
Crude oil was down -3.72% to close at 77.94. The 75-76 level has been a recent support level for crude.
Here are some of today’s closing prices.
E-mini S&P 500 Top-Down Analysis

📈 Below are the monthly (5-years), weekly (2-years) and daily (6-months) charts for ES.
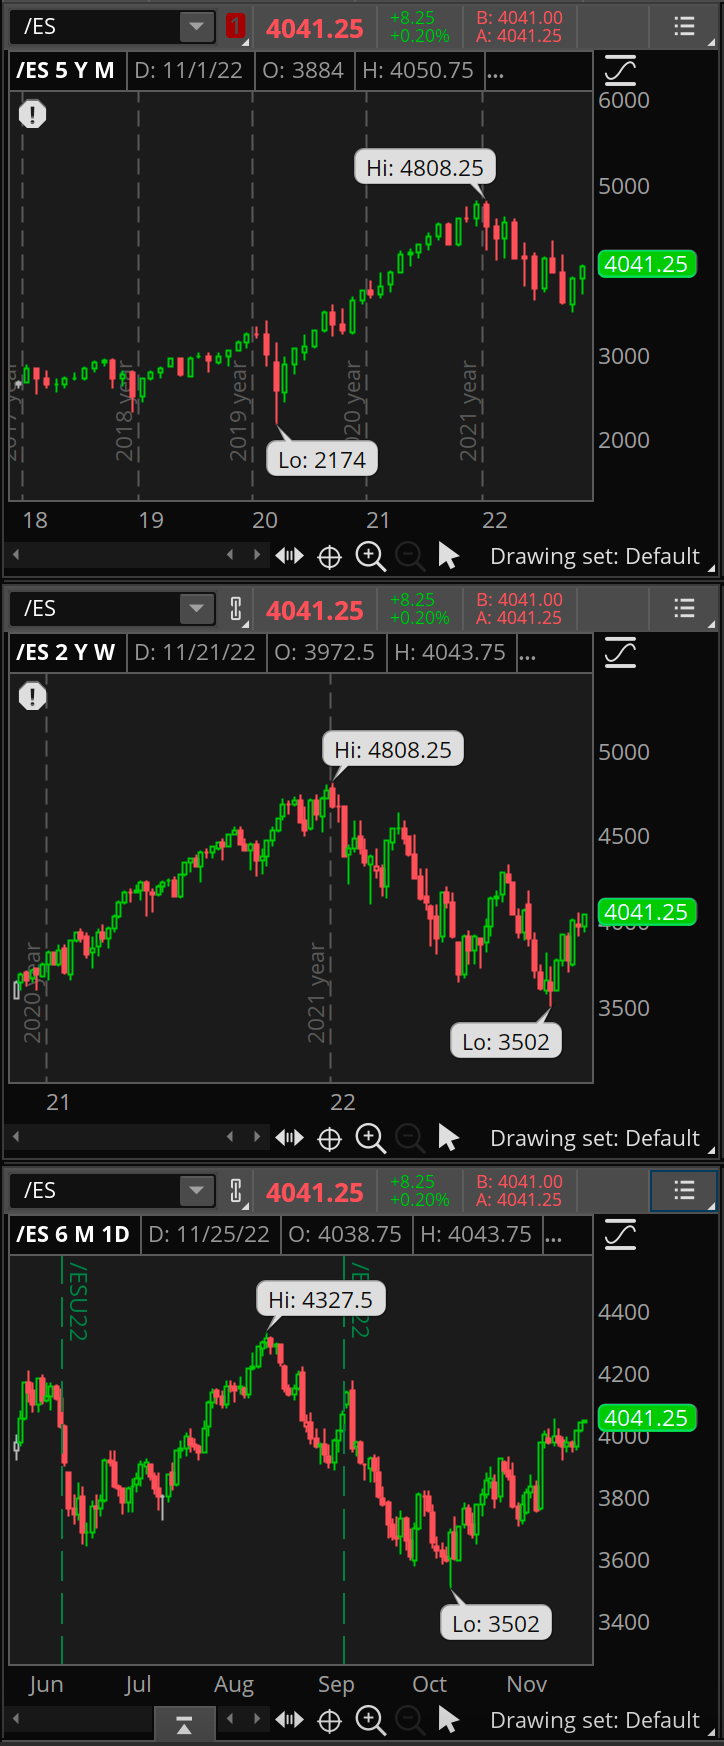
M/M: As long as ES remains above 3502, it will be OTFU. September’s high at 4175 is the next upside target.
W/W: ES is OTFU as it remained above the prior week’s low for the second straight week. ES broke out above the prior week’s high but failed to remain as it closed inside last week’s close.
D/D: The past two sessions have failed to take out the prior day’s low and are OTFU. However, the past 9 sessions have been in balance and rotational between 3912.50 and 4050.75.
E-mini S&P 500 Metrics
Recent Performance & Technicals


E-mini S&P 500 Volume/Market Profile
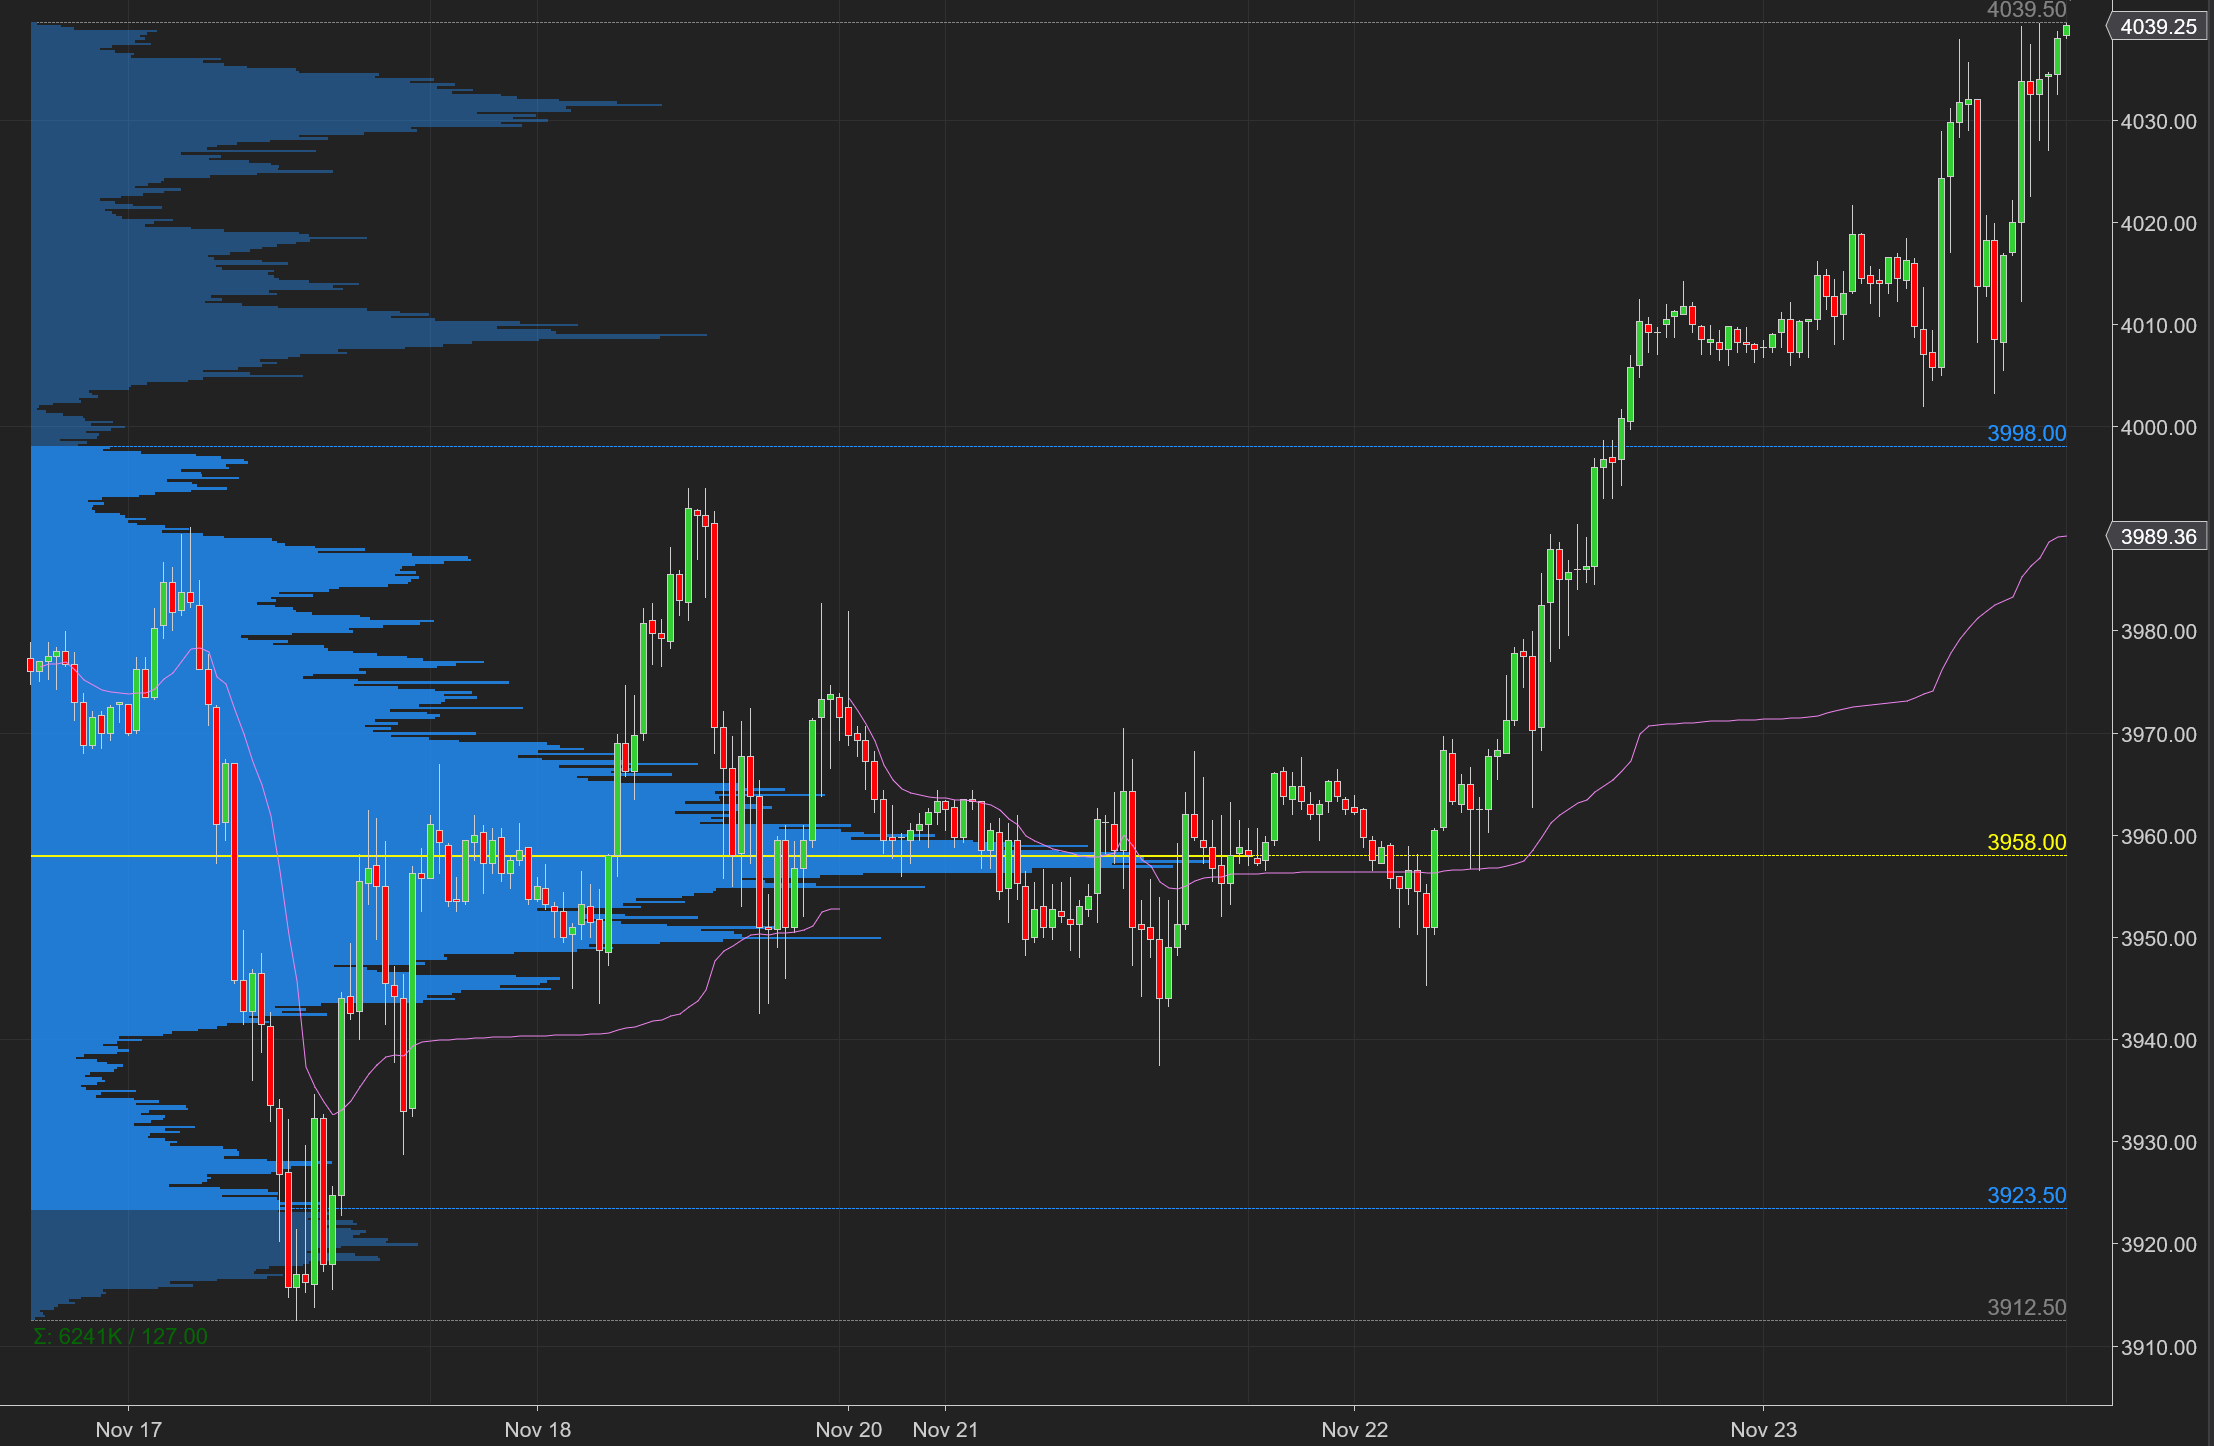
ES Composite Volume Profile (5 days)
📈 Here is a chart of the past five sessions with a composite ETH Volume Profile:
ES ETH/RTH Split Volume Profile (5 days)
📈 Here is a chart of the past five sessions with a daily ETH/RTH split Volume Profile:

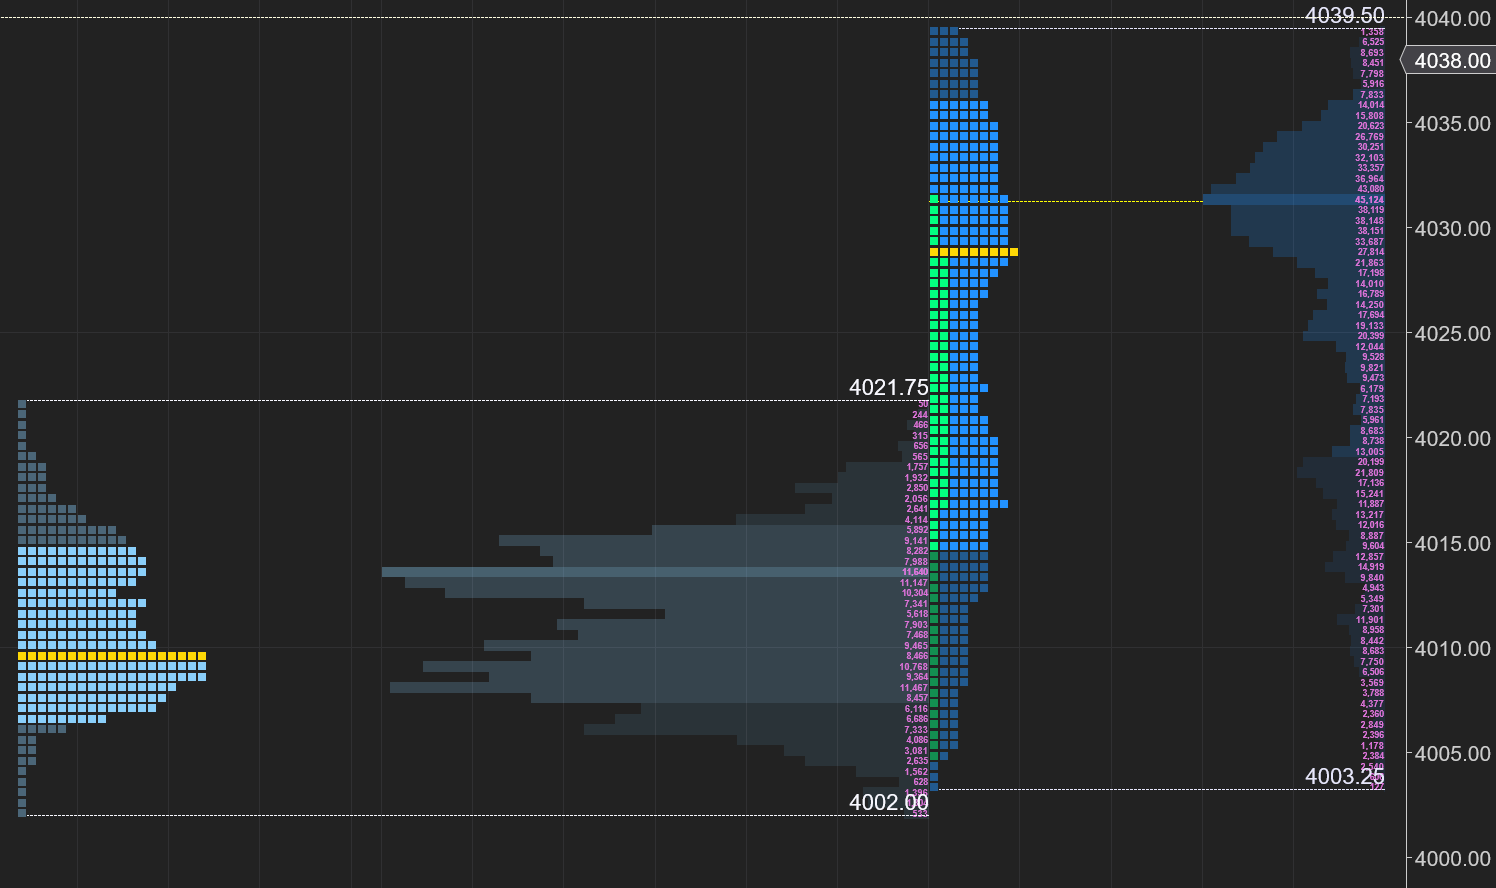
ES ETH/RTH Split Market/Volume Profile (today)
📈 Here’s a TPO chart of today’s session with ETH/RTH split Market/Volume Profile:
ES Market/Volume Profile Levels

RTH Weak High/Low: 4039.50 (triple top)
RTH Single Prints: n/a
RTH Excess: 4003.25 to 4005
RTH Gap: n/a
Session Recap
Electronic Trading Hours (ETH)
Globex Session:
Wholesale was long at the prior day’s close. The overnight open was inside the prior day’s value area. Inventory during Globex was balanced and rotational. It was flat through the Japan open. Then leading into the London open, things began to pick up a little and the auction got long. Responsive shorts were absorbed and ES went above the prior day’s high before stalling at 4021.75. Some corrective moves ensued and then there was a sharp 10-point move down after some economic data came out at 8:30am EST. This took ES underneath VWAP and the previous day’s VPOC.
Range: 19.75
Regular Trading Hours (RTH)
US Session:
The RTH open was inside of the previous day’s value area and above the T+2 high. There was a strong bid at the open that quickly absorbed sellers. As a result, buyers had no problem lifting the offer. ES climbed 25-points in A-period to cruise past the overnight high and previous day’s high. There was some responsive selling at 4029, near the R1 pivot area. Once supply was absorbed here, ES continued to move up. ES stalled and couldn’t lift the offer above 4038. In E-period, selling pressure increased and the market fell 20-points. After some short covering, it fell even more to wipe out the prior low from A-period. Sellers weakened and the bid held up at a 4003.25. ES eventually made its way up to VWAP right when the FOMC minutes were released at 2pm EST. The market initially sold off 8-handles, but then shot up nearly 30-points as the bid absorbed shorts. ES went on to trade back and forth in a 10 to 15-point range, while making new session highs. ES topped out at 4039.50, which was a weak high. RTH ended a tick lower.
Range: 36.25