
11/22/2022 Synopsis
Equity indexes climb +1%. For the S&P 500, it was the first day with a move of 1% or greater in 7 trading days.

Market Overview

Equities caught a bid and each index finished up more than 1%, led by the Nasdaq (+1.36%). The Russell gained +1.16% and fare the worst. The S&P is now 1.4% from its 200-day MA. Every S&P sector was green today. Energy gained +3.13% to lead the way. Real estate was the straggler gaining only +0.50%.
US Treasury yields all made moves of nearly 1% or more as well. The 3-month bill gained 9 bps to close at 4.20%. The 2-year note fell 4.4 bps to end the day at 4.52%. The 10-year finished down at 3.76%, losing 7.5 bps.
The US Dollar index slid -0.58% to 107.15.
Crude oil was up +2.8% at one point intra-day but lost some of those gains. It closed up +1.14% at 80.95.
Here are some of today’s closing prices.

E-mini S&P 500 Top-Down Analysis

📈 Below are the monthly (5-years), weekly (2-years) and daily (6-months) charts for ES.
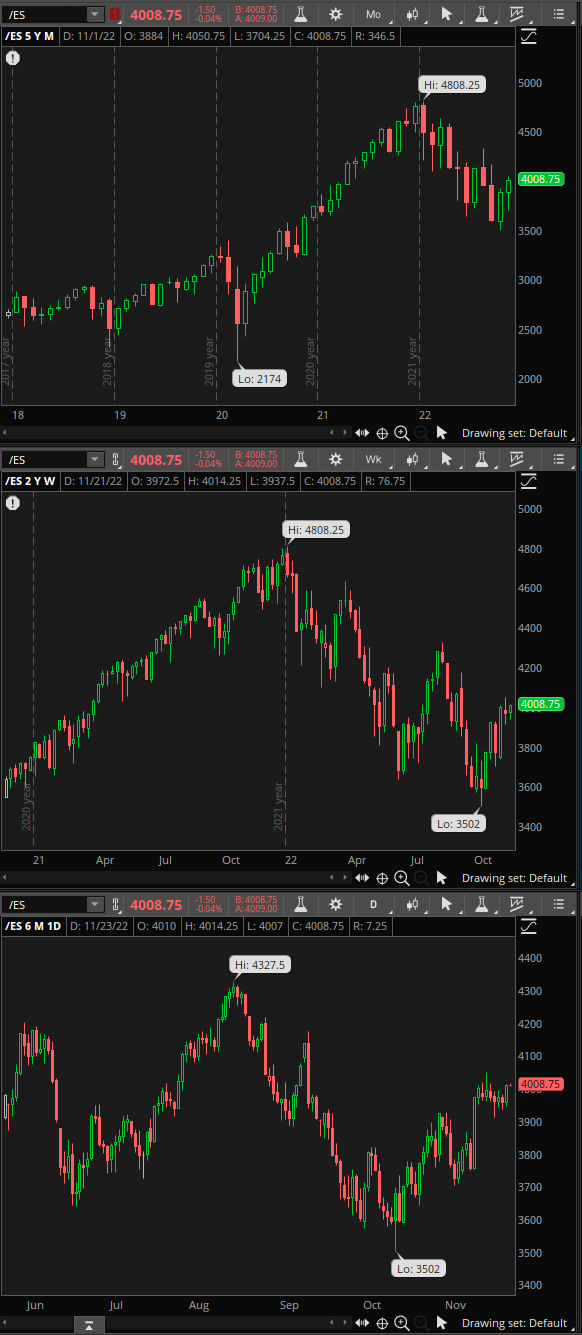
M/M: As long as ES remains above 3502, it will be OTFU. September’s high at 4175 is the next upside target.
W/W: ES is OTFU as it remained above the prior week’s low for the second straight week. ES broke out above the prior week’s high but failed to remain as it closed inside last week’s close.
D/D: The past 8-sessions have been in balance and rotational between 3912.50 and 4050.75.
E-mini S&P 500 Metrics
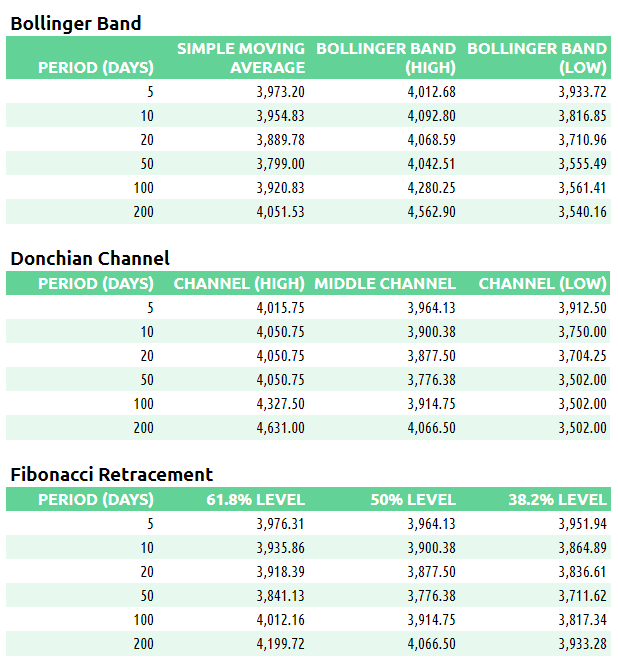
Recent Performance & Technicals

E-mini S&P 500 Volume/Market Profile
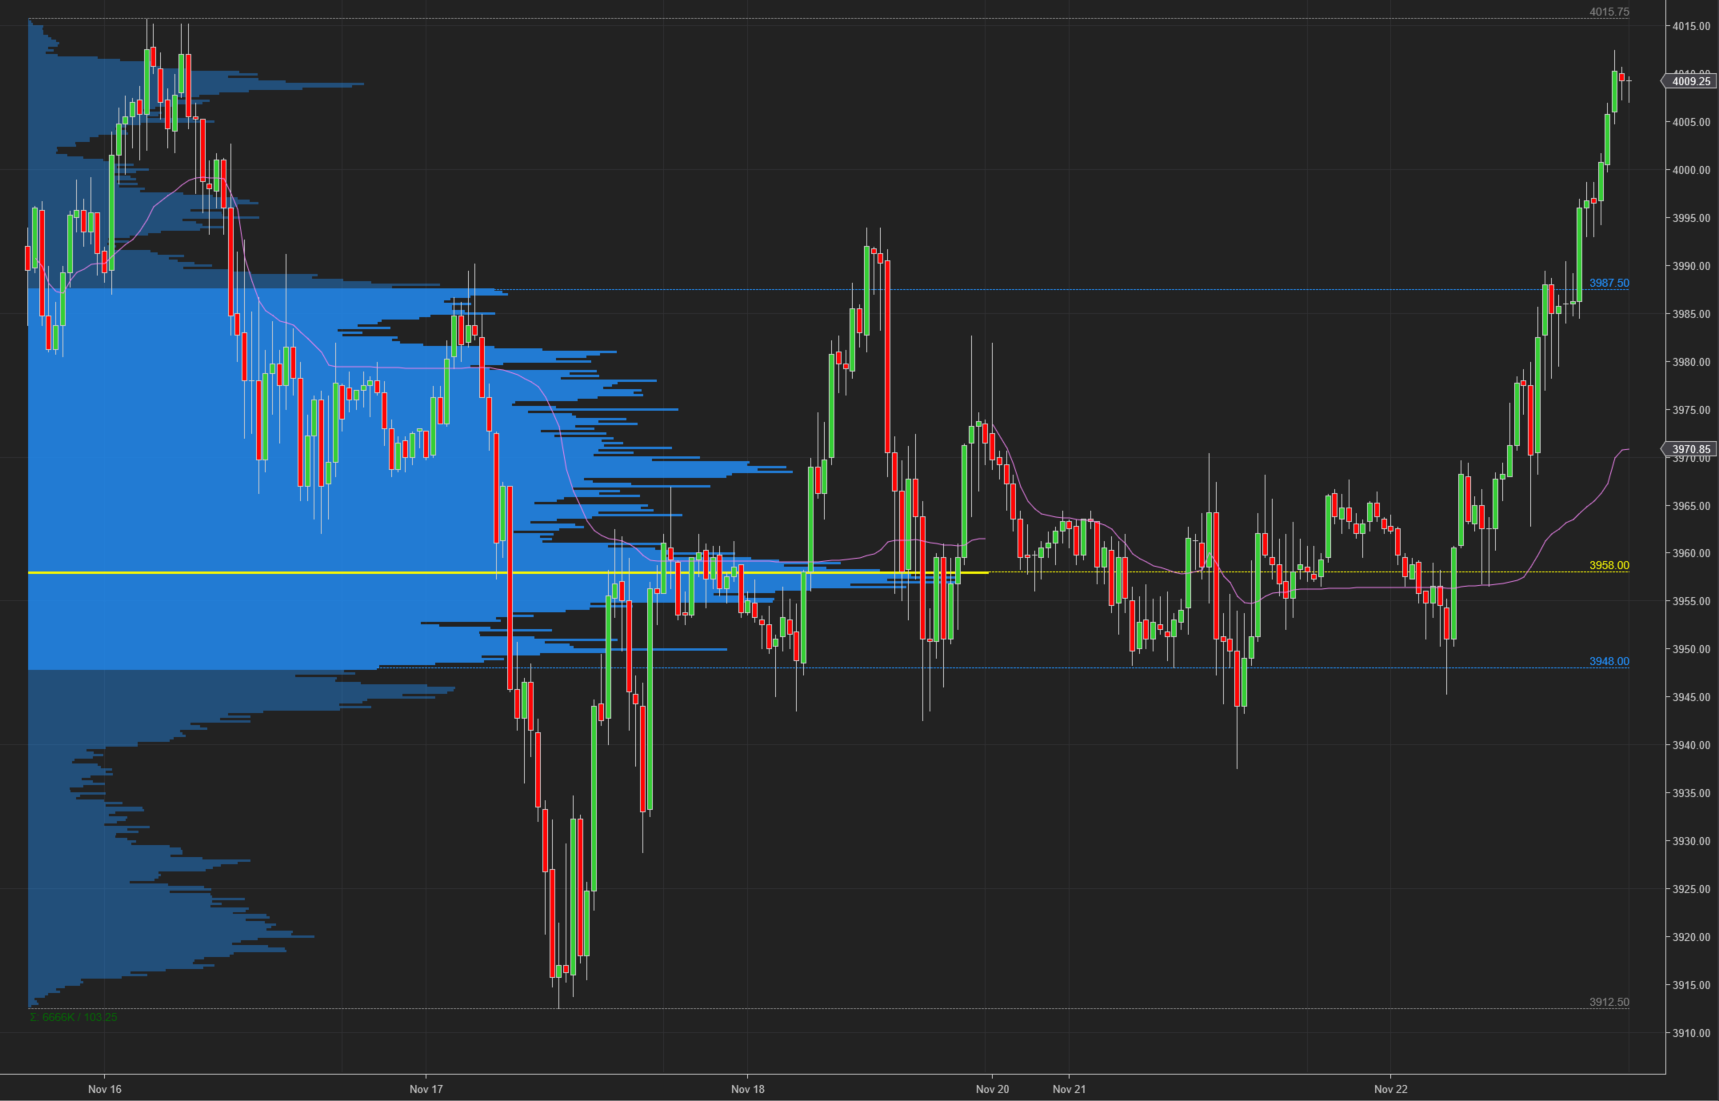
ES Composite Volume Profile (5 days)
📈 Here is a chart of the past five sessions with a composite ETH Volume Profile:
ES ETH/RTH Split Volume Profile (5 days)
📈 Here is a chart of the past five sessions with a daily ETH/RTH split Volume Profile:

ES ETH/RTH Split Market/Volume Profile (today)
📈 Here’s a TPO chart of today’s session with ETH/RTH split Market/Volume Profile:

ES Market/Volume Profile Levels
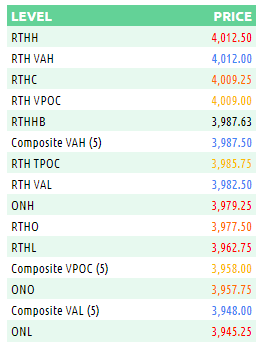
RTH Weak High/Low: n/a
RTH Single Prints: 3990.5 to 3993; 3998.75 to 3999.75; 4001.75 to 4004.75
RTH Excess: 3962.75 to 3977; 4010.75 to 4012.50
RTH Gap: n/a
Session Recap
Electronic Trading Hours (ETH)
Globex Session:
Wholesale was short at the prior day’s close. The overnight open was inside of the prior day’s value area. Inventory during Globex was rotational but mostly long, 78% of the time. After the Asian open, ES had a bid but couldn’t quite take out the prior day’s high. Supply above 3967.75 kept ES from continuing its rise and inventory corrected. The auction slowly ticked down before supply shut off at 3945.25. In the latter half of London’s opening hour, buyers swooped in and lifted ES from this bottom. Over the remainder of Globex going into RTH, ES gradually ticked up 34-handles. Longs were able to eclipse the prior day’s high and went on to lift ES to new session highs.
Range: 34
Regular Trading Hours (RTH)
US Session:
The RTH open was above the previous day’s value area and slightly beneath the high. It was also underneath the T+2 high. There was some responsive selling in A-period which caused ES to slide 20-points after the open. This was absorbed by buyers and the selloff was halted at 3962.75. Supply diminished and buyers took it from here. From A to G-period, ES was OTFU and rose above the prior day’s high. The move up covered 30-points but began to trade in balance once inventory was hit near 3990.50. In H-period, ES caught another bid and took off above the balance range and the T+2 high. ES made new session highs the remainder of RTH eventually topping out at 4012.50 when buyers lost steam. ES closed RTH at 4009.25.
Range: 49.75