
11/16/2022 Synopsis
S&P fell again as equity indices consolidate. Homebuilder sentiment hit a decade low. October retail sales were stronger than anticipated.

Market Overview

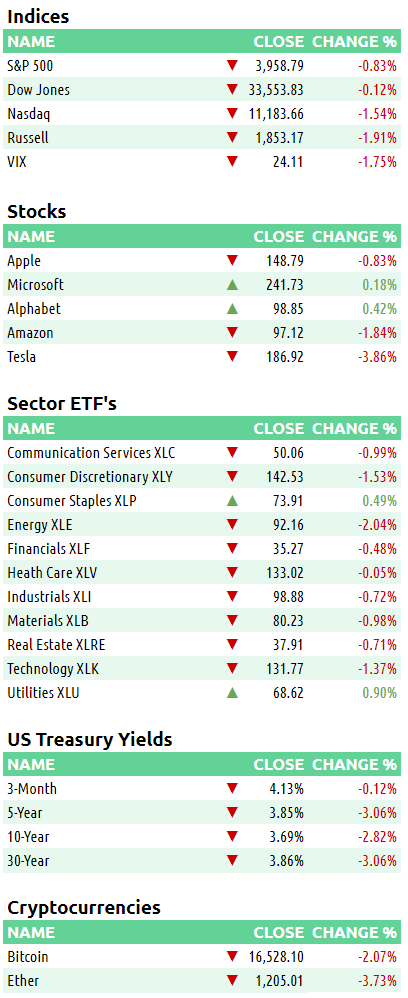
Equities fell today as the major indices consolidate following last week’s rally. The Dow led the way losing only -0.12%. The Russell 2000 was hit the hardest, losing -1.91%. Two S&P sectors registered gains today, consumer staples XLP 0.00%↑ and utilities XLU 0.00%↑. Energy XLE 0.00%↑ dropped the most.
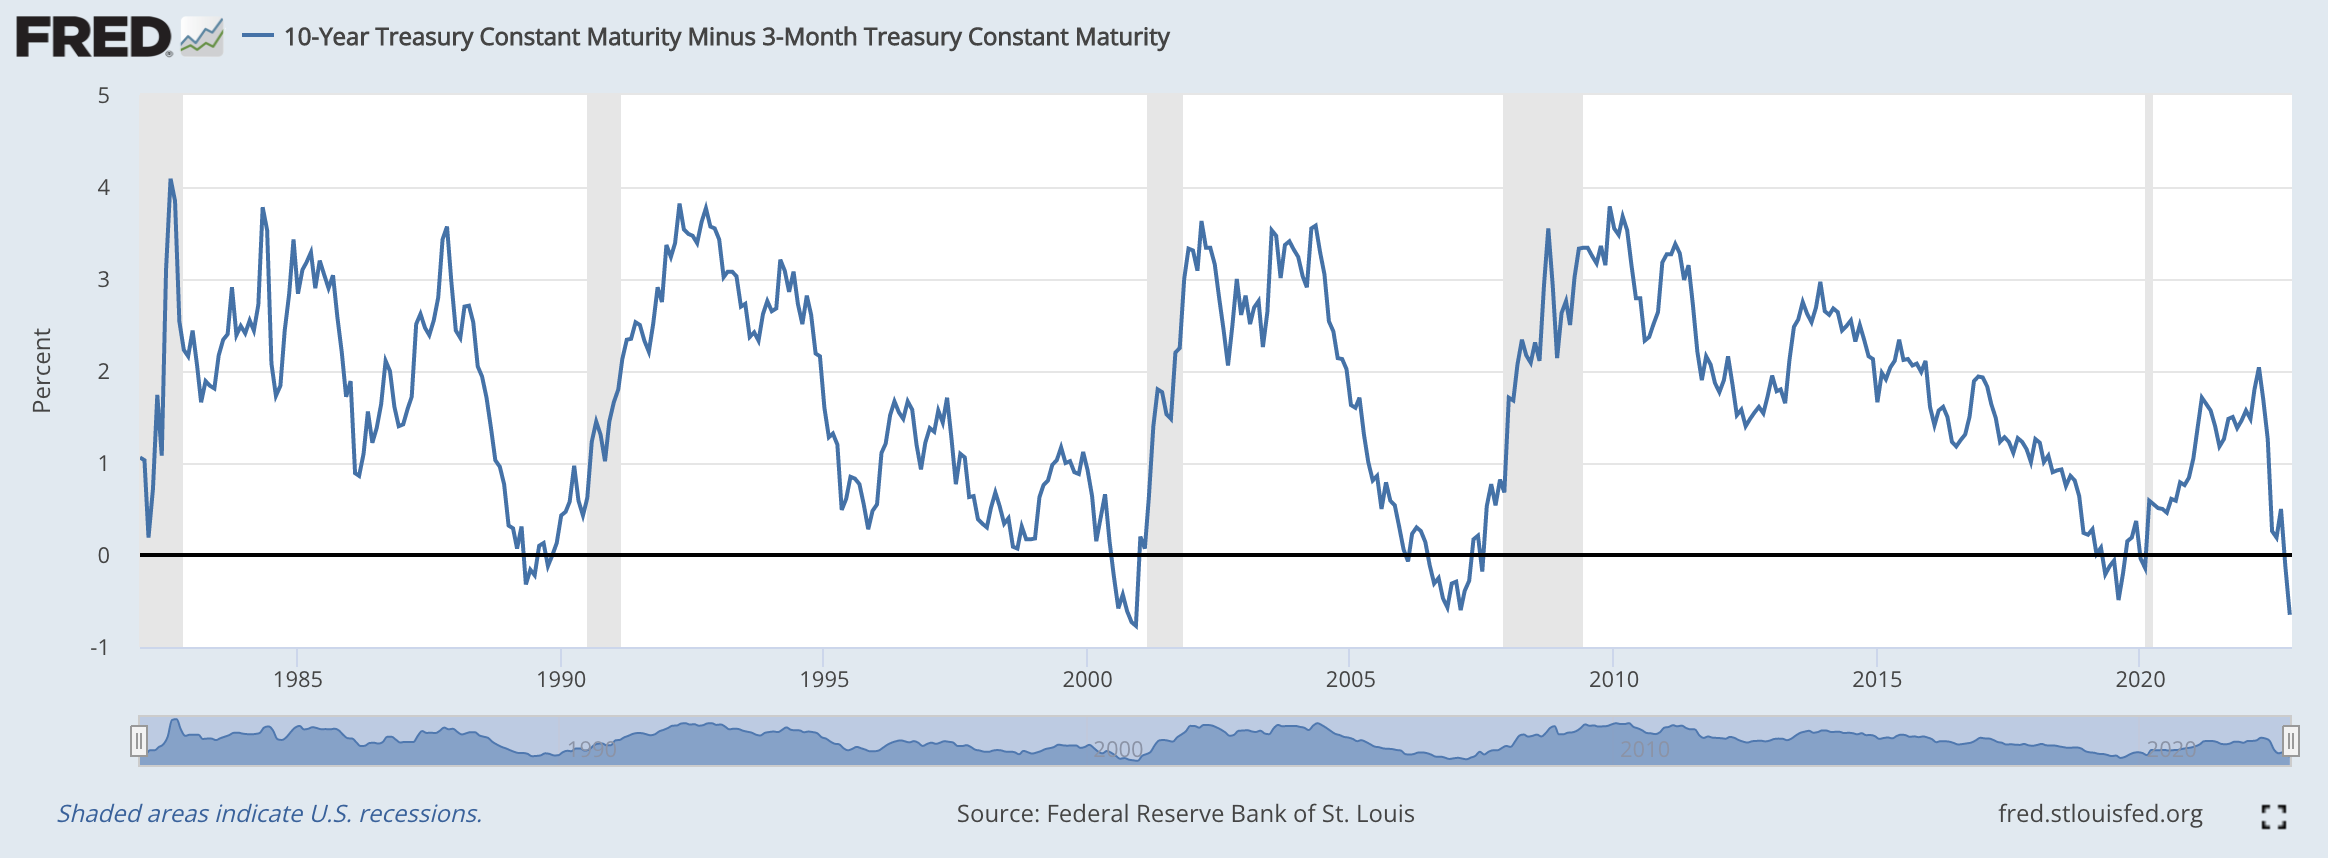
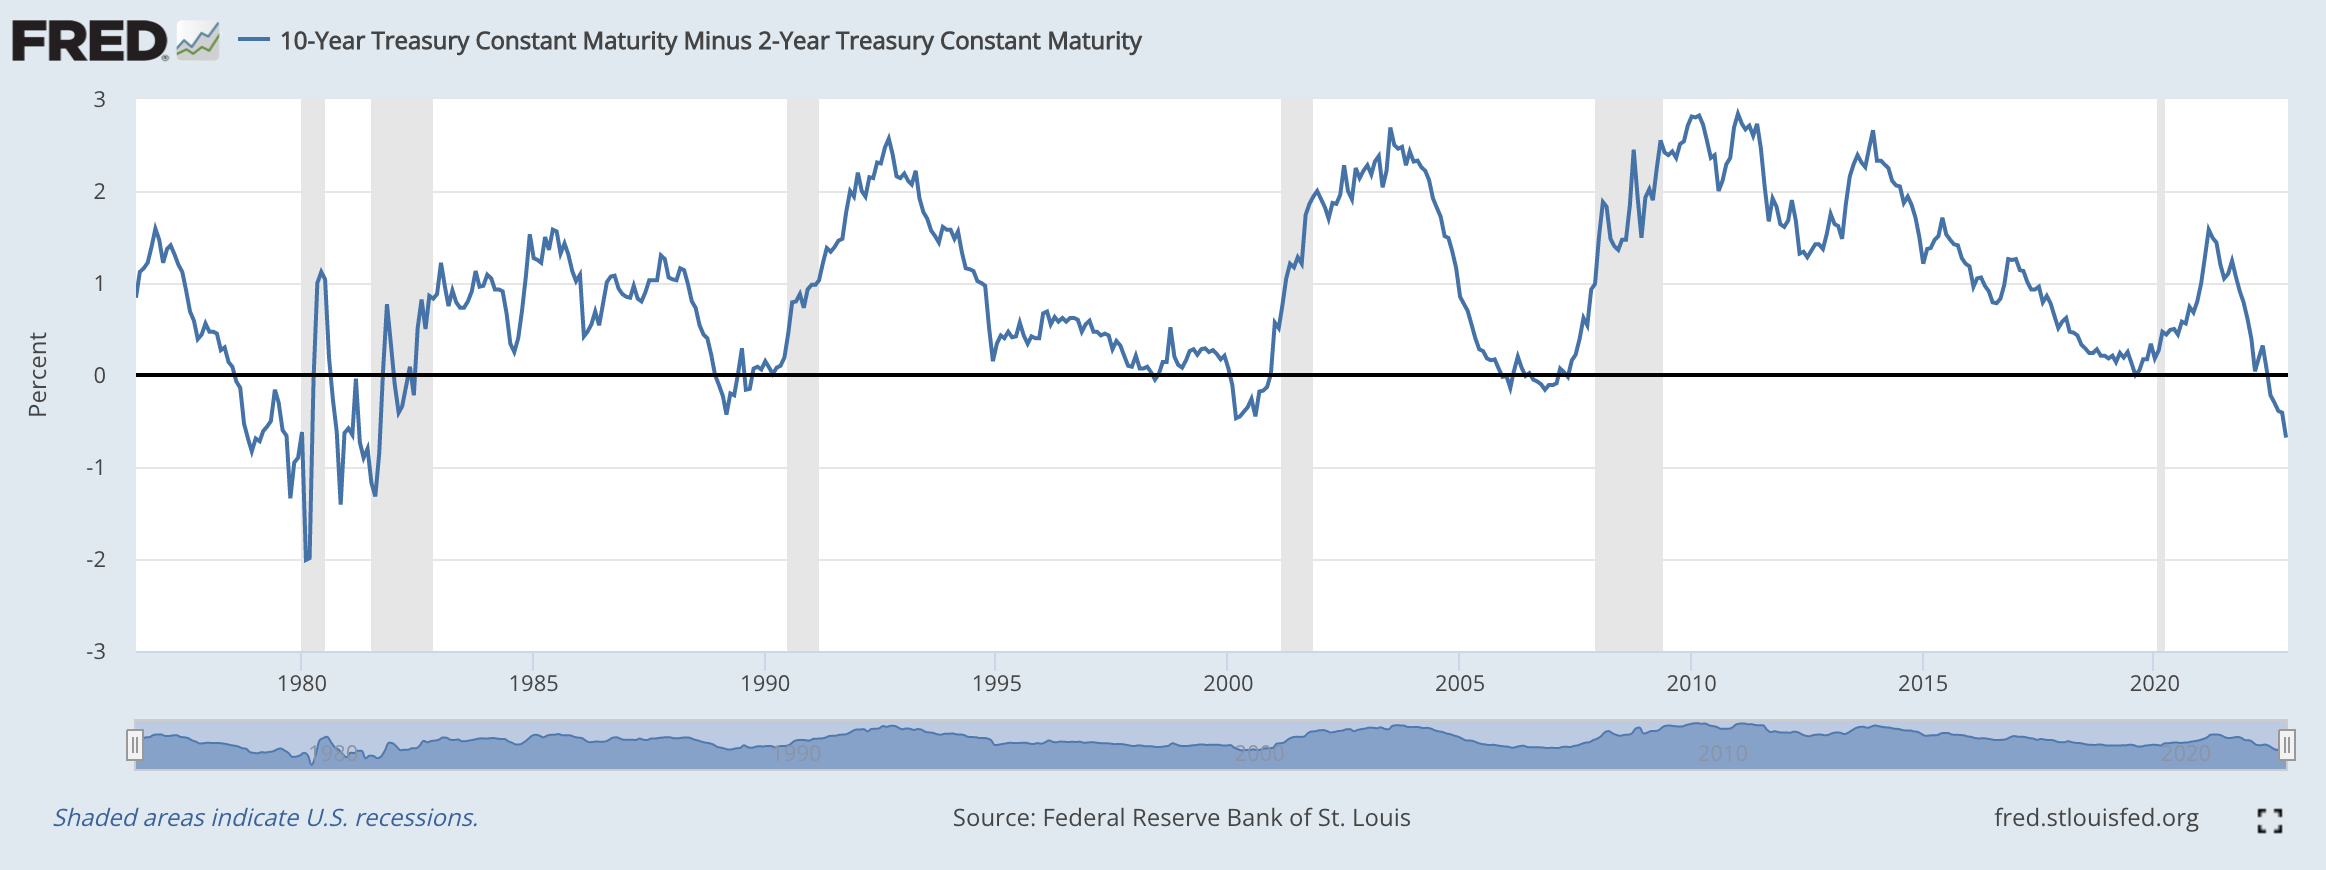
US Treasury yields were mixed on the day. The 3-month T-bill fell 1 bp to 4.13%. The 2-year T-note had a small gain of +0.32%, closing at 4.36%. The 10-year yield lost -2.15% to finish the day at 3.69%. The 10Y-3M yield curve now has its steepest inversion, -65 bps, since the 2001 recession. The 10Y-2Y yield curve, with an inversion of -68 bps, is the steepest since the 1981 recession.


The US Dollar index $DXY fell -0.27% to 106.29.
Crude oil fell -1.53% to 85.59.
Here are some of today’s closing prices.
E-mini S&P 500 Top-Down Analysis

📈 Below are the monthly (5-years), weekly (2-years) and daily (6-months) charts for ES.

M/M: As long as ES remains above 3502, it will be OTFU.
W/W: As long as ES remains above 3738.25, it will be OTFU.
D/D: ES followed up yesterday’s outside day with an inside day. All of today’s price action was inside of yesterday’s high and low.
E-mini S&P 500 Metrics
Recent Performance & Technicals


E-mini S&P 500 Volume/Market Profile
ES Composite Volume Profile (5 days)
📈 Here is a chart of the past five sessions with a composite ETH Volume Profile:

ES ETH/RTH Split Volume Profile (5 days)
📈 Here is a chart of the past five sessions with a daily ETH/RTH split Volume Profile:
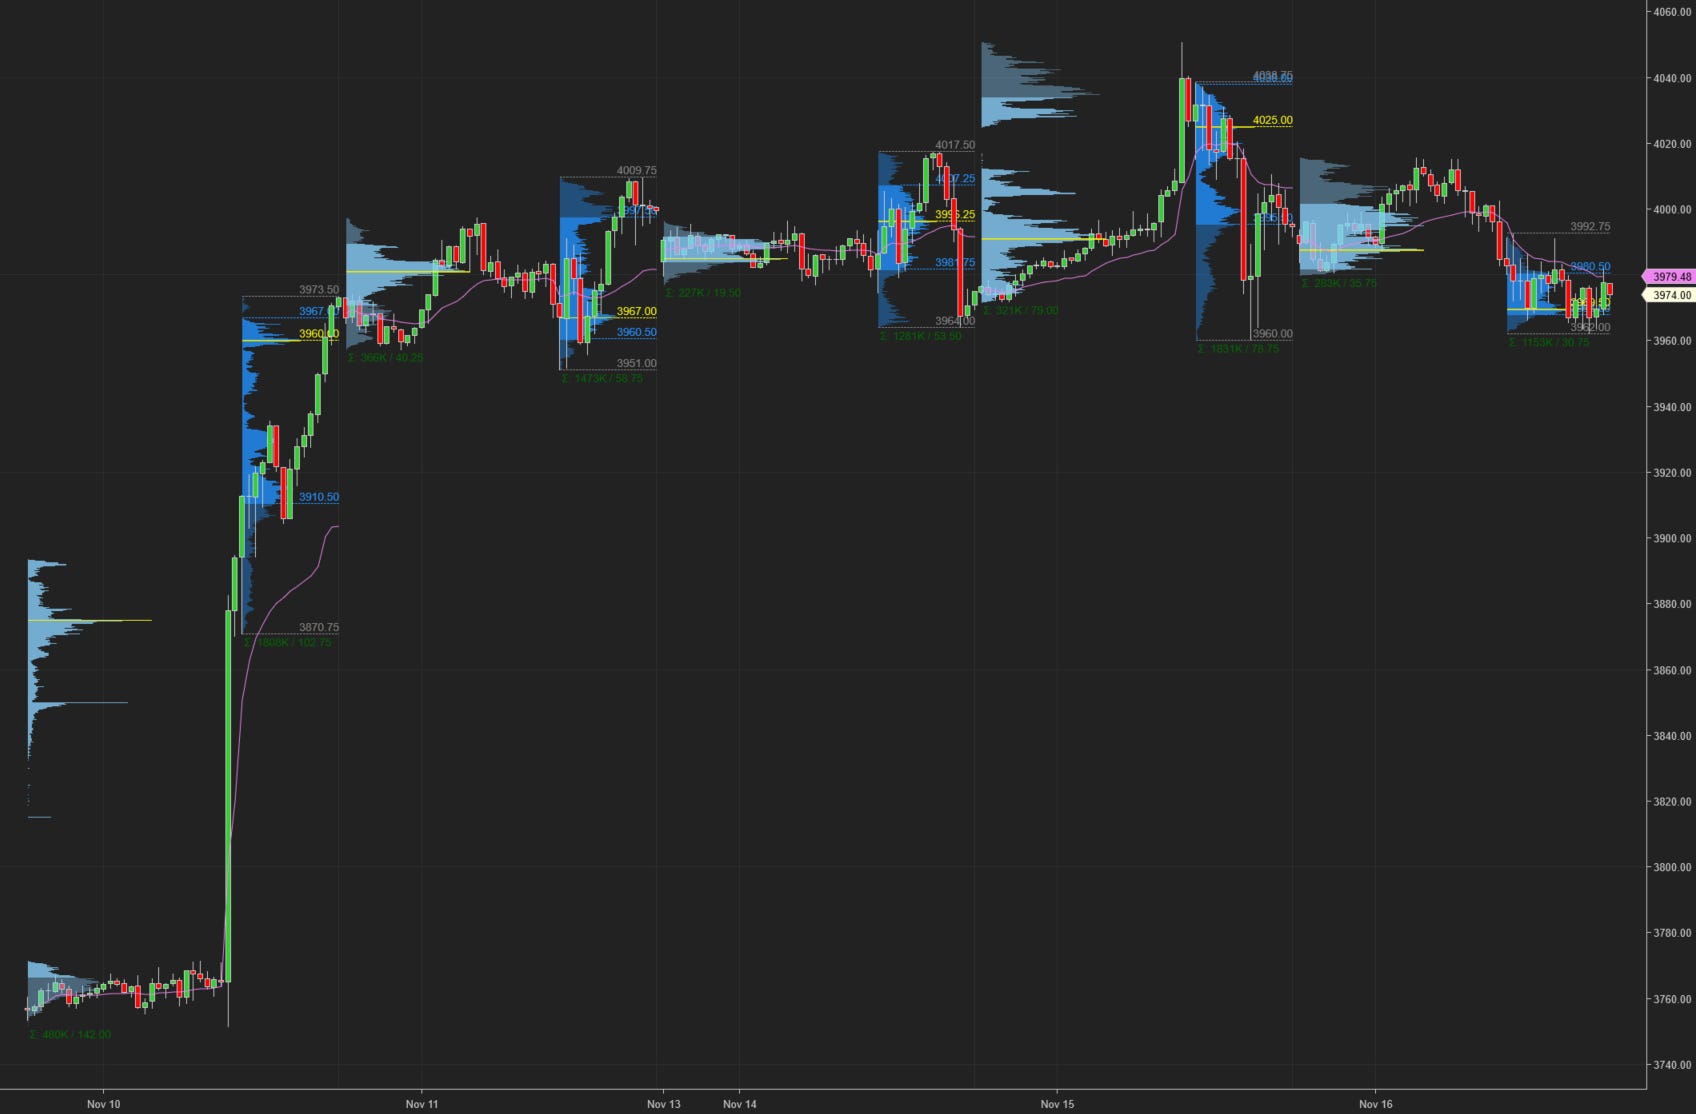
ES ETH/RTH Split Market/Volume Profile (today)
📈 Here’s a TPO chart of today’s session with ETH/RTH split Market/Volume Profile:

ES Market/Volume Profile Levels

RTH Weak High/Low: n/a
RTH Single Prints: n/a
RTH Excess: 3962 to 3963.5; 3991.25 to 3992.75
RTH Gap: n/a
Session Recap
Electronic Trading Hours (ETH)
Globex Session:
Wholesale was long at the prior day’s close. The overnight open was below the prior day’s value area but above the low of the day. Inventory during Globex was rangebound in a 35-point channel but mostly long. There was supply above 4015.75. A weak low was placed at 3980.50, a sign of strong demand and trapped bids below. VPOC for Globex was 3987.50.
Range: 35.25
Regular Trading Hours (RTH)
US Session:
The RTH open was below the previous day’s value area but inside the low of the day and T+2 low. In A-period, ES failed to get over VWAP so it rotated back and forth in a 20-point range. Supply was able to push ES beneath the overnight low before encountering a wall of bids at 3972. Supply shut off and ES rotated back and forth in a 15-point range during B-period. For the remainder of the day, ES rotated back and forth in a 30-point range mostly below VWAP. In addition, the RTH range was entirely below the prior day’s value area. After failing to accept above VWAP during G-period, supply slowly pressured ES lower. Shorts came to within 2-points of taking out the prior day’s low but supply shut off. They couldn’t drop the bid underneath 3962. As a result, ES rose 20-points and couldn’t accept over VWAP again before ending RTH at 3974.
Range: 30.75