
11/15/2022 Synopsis
Equities gained as PPI fell on a Y/Y basis for the fourth straight month.

Market Overview


Every index was up again, led by the Russell 2000 and the Nasdaq. The S&P 500 is a 2% from testing its 200-day MA. Nine S&P sectors were positive for the day as health care XLV 0.00%↑ and materials XLB 0.00%↑ both fell.
With the exception of the 3-month T-bill, US Treasury yields fell. The 3-month gained +6 bps to close at 4.14%. The 2-year T-note fell to 4.345% (-1.09%). The 10-year had a larger fall to end the day at 3.773% (-2.18%). It’s now fallen nearly 13% since hitting 4.335% intra-day on Oct 21st.
The US Dollar index $DXY dropped to $106.571 (-0.35%), down 7% from it’s Sept 28th intra-day high of $114.778.
Crude oil ascended to $86.92 (+1.22%).
Here are some of today’s closing prices.

E-mini S&P 500 Top-Down Analysis

📈 Below are the monthly (5-years), weekly (2-years) and daily (6-months) charts for ES.

M/M: As long as ES remains above 3502, it will be OTFU.
W/W: As long as ES remains above 3738.25, it will be OTFU.
D/D: ES had an outside day where it traded beneath the prior day’s low and above the prior day’s high.
E-mini S&P 500 Metrics
Recent Performance & Technicals


E-mini S&P 500 Volume/Market Profile
ES Composite Volume Profile (5 days)
📈 Here is a chart of the past five sessions with a composite ETH Volume Profile and single prints/trapped short positions highlighted:
ES ETH/RTH Split Volume Profile (5 days)
📈 Here is a chart of the past five sessions with a daily ETH/RTH split Volume Profile:

ES ETH/RTH Split Market/Volume Profile (today)
📈 Here’s a TPO chart of today’s session with ETH/RTH split Market/Volume Profile:

ES Market/Volume Profile Levels

RTH Weak High/Low: n/a
RTH Single Prints: n/a
RTH Excess: 3960 to 3964; 4037.50 to 4038.75
RTH Gap: n/a
Session Recap
Electronic Trading Hours (ETH)
Globex Session:
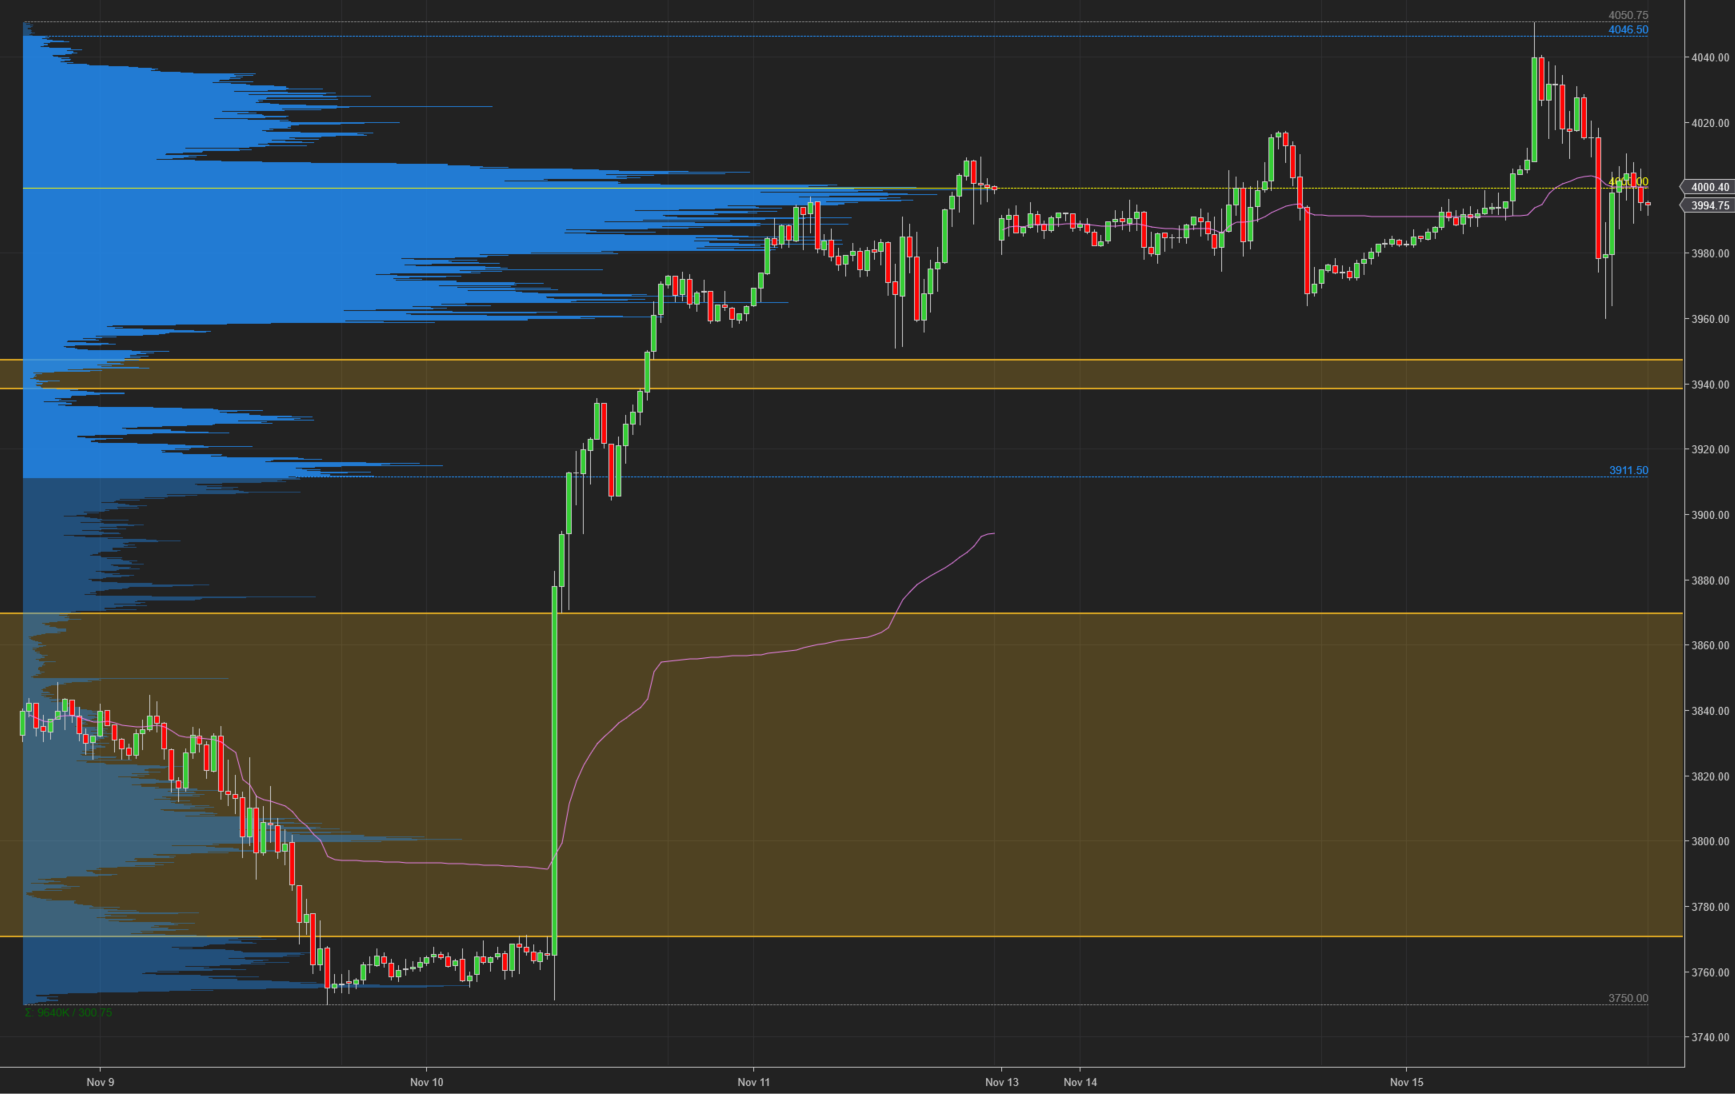
Wholesale was short at the prior day’s close. The overnight open was below the prior day’s value area and above the LOD. Inventory during the overnight session was mostly long, 90% of the time. Trapped shorts from Nov 10th, were still providing support for ES. There was a lack of supply during the overnight session as the auction failed to test the previous day’s low. This led to a rotation to the upside where ES accepted above VWAP and inside the prior day’s value area. ES slowly crept up higher towards the top of the value area throughout Globex. When the producer price index figures were released at 8:30am EST, ES ripped 40-points higher to get above the prior day’s high. On the move to the upside, there were no trades from 4017 to 4024.50. Supply pushed the auction down about 25-points prior to RTH.
Range: 79
Regular Trading Hours (RTH)
US Session:
The RTH open gapped up and was above the prior day’s high, as well as the T+2 high. In A and B-period, ES rotated back and forth between VWAP and the first standard deviation. Buyers failed to lift ES above 4038.75. ES slowly trended lower making lower highs the next few TPO periods. In H-period, ES broke down intra-day support at 4009, as it fell 45-points. It continued to drop and eclipsed the previous day’s low. Supply cut off as sellers couldn’t take down the offer at 3960. As a result, short covering lifted ES 50-points to get back into the prior day’s value area. The auction failed to accept over VWAP, reversing at 4010.75. ES remained rangebound before closing RTH at 3994.75.
Range: 78.75