
11/10/2022 Synopsis
October CPI came in lower than anticipated at 7.7% Y/Y. Risk assets jumped with the major indices having their best day in years. Cryptocurrencies rallied amid the FTX debacle.

Market Overview

Equities jumped on the lighter than expected CPI print. The S&P 500 had its single best day since April 2020. It is now a 3% move away from its 200-day MA. The Nasdaq led all indices accelerating 7.35% today. Every S&P sector was green.
Stud: Technology XLK 0.00%↑ (+8.22%)
Dud: Energy XLE 0.00%↑ (+2.23%)
US Treasuries all flamed out. The 2-year T-note dropped to 4.338% (-5.37%). The 10-year note was knocked down to 3.818% (-6.81%).
The US Dollar index flopped to $107.93 (-2.28%), its lowest level in 2-months. This $107-108 level was a resistance level from July to August. It’s since become support. This is the third test of the $107.50 area since August. The prior two times each led to a bounce higher.
Crypto added $87B in market cap today (+11.64%).
Cathie Wood’s Ark Innovation ETF, ARKK 0.00%↑, jumped 14% today. It was the best day in the fund’s history.
Here are some of today’s closing prices.

E-mini S&P 500 Top-Down Analysis

📈 Below are the monthly (5-years), weekly (2-years) and daily (6-months) charts for ES.

M/M: ES is still OTFD but after setting new lows for 2022 it rebounded and finished up 7.8%.
W/W: ES had an outside week in which it traded just above the previous week’s high, as well as below the previous week’s low. It finished down 3.37% and is in balance. ES closed below the 10-week MA.
D/D: From the August intraday high to the October intraday low, ES is showing signs of potentially accepting above the 50% level of that move.
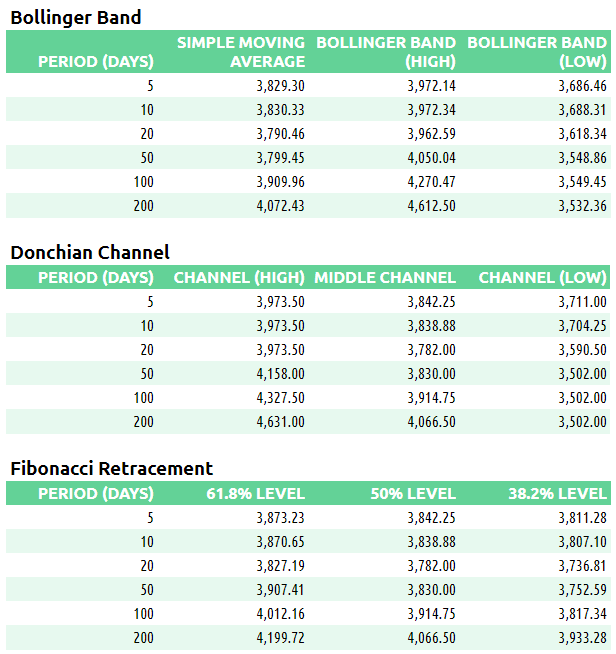
E-mini S&P 500 Metrics
Recent Performance & Technicals

E-mini S&P 500 Volume/Market Profile
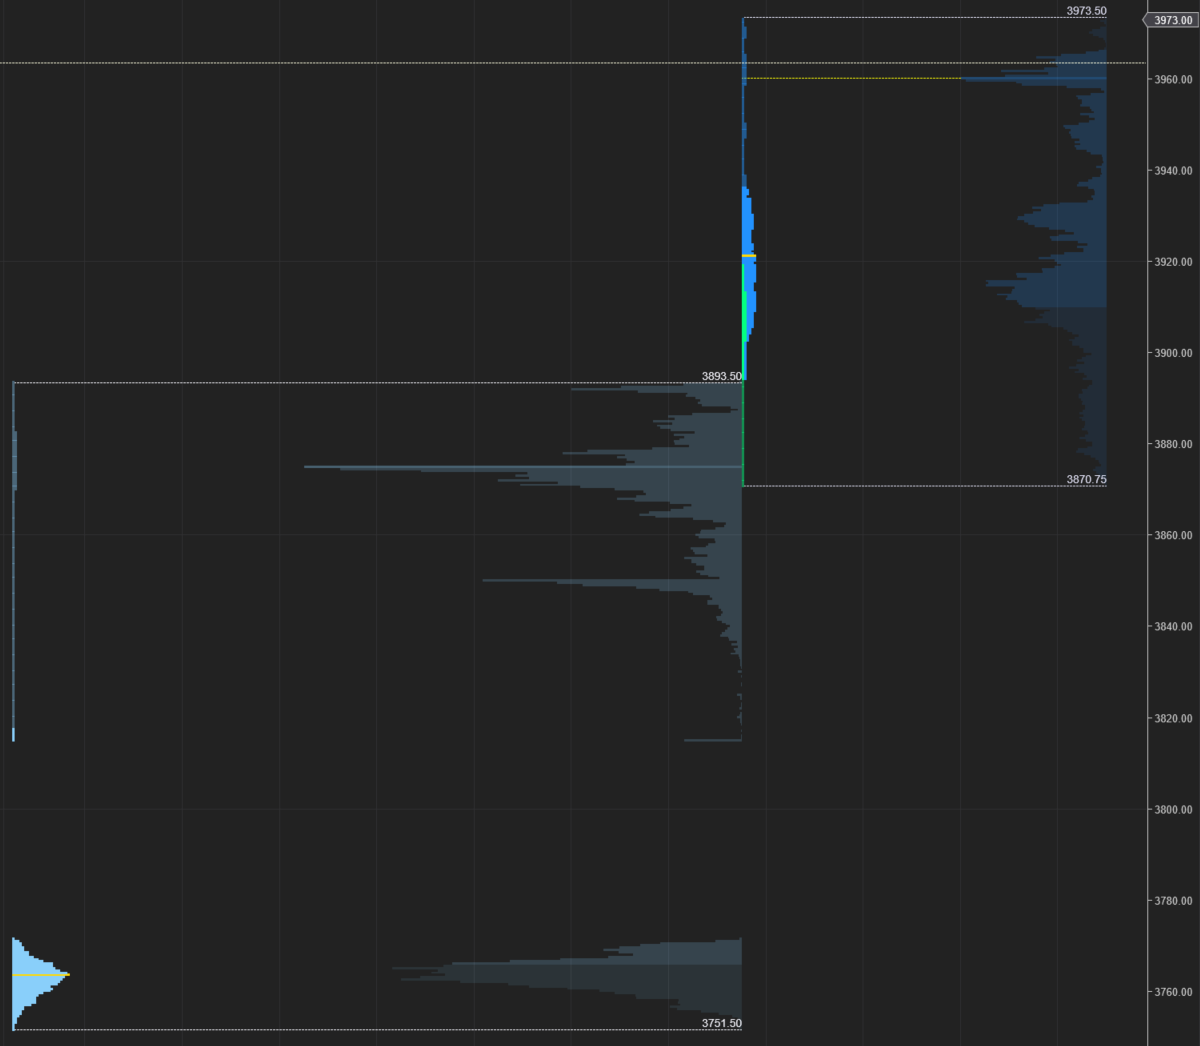
ES Composite Volume Profile (5 days)
📈 Here is a chart of the past five sessions with a composite ETH Volume Profile:

ES ETH/RTH Split Volume Profile (5 days)
📈 Here is a chart of the past five sessions with a daily ETH/RTH split Volume Profile:

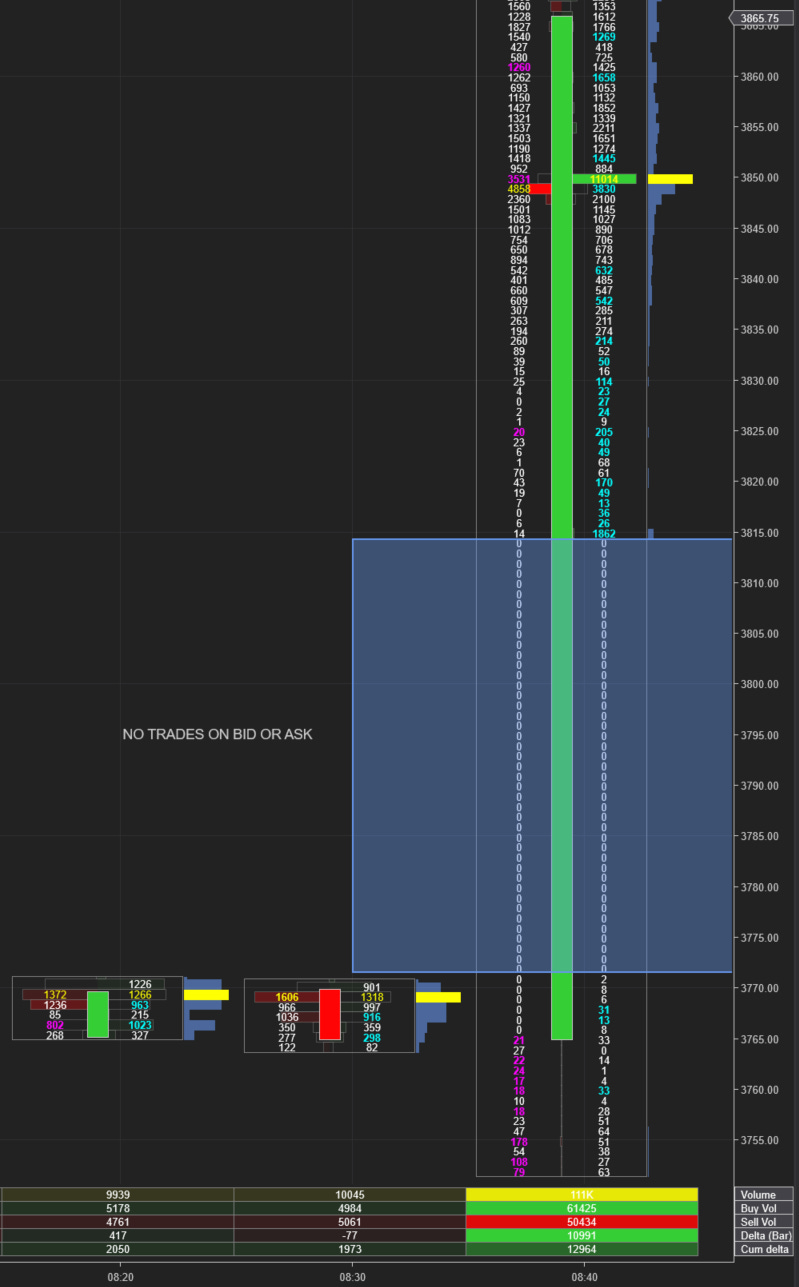
ES ETH/RTH Split Market/Volume Profile (today)
📈 Here’s a TPO chart of today’s session with ETH/RTH split Market/Volume Profile:
ES Market/Volume Profile Levels
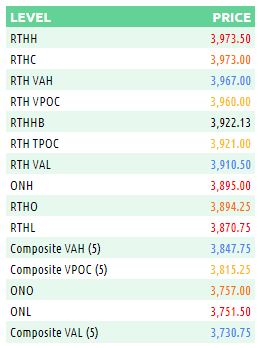
RTH Weak High/Low: n/a
RTH Single Prints: 3938.75 to 3947.50; 3950.50 to 3958.75; 3965.50 to 3969.25
RTH Excess: 3870.75 to 3894.25; 3971.50 to 3973.50
RTH Gap: 3825.75 to 3870.75
Session Recap
Electronic Trading Hours (ETH)
Globex Session:
Wholesale was short at the prior day’s close. The overnight open was below the prior day’s value area but above the low of the day. Inventory during Globex was mostly long over the previous day’s close. However, the price action was constrained between the previous day’s VAL and LOD. There wasn’t sufficient demand or supply to initiate a move in either direction with October’s CPI print looming. When CPI was announced lower than forecasted, ES jumped 110-points in 2-minutes. Supply was shut off as buyers kept on lifting the bid just shy of 3900 for the overnight session. All significant levels were taken out (prior day’s high, T+2 high, pivot and Fib levels). The large move up post-CPI left a 30-point area with no trading volume which means shorts were trapped.
Range: 143.50
Regular Trading Hours (RTH)
US Session:
The RTH open gapped up and was above the prior day’s high and T+2 high. Inventory corrected as responsive sellers pressured ES lower by 20-points at the open. However, buyers were able to absorb this supply, shutting it off, as they pushed ES through the 3900 level. Buyers moved the auction above the 3907 high from Nov 2nd. Buyers continued to lift the bid above the Nov 1st high of 3928. At 3935.75, buyers began to lose steam as supply was met. Wholesale took the market down to backfill demand, resulting in a 30-point fall. Once the bid appeared, supply was cut and ES rose to eclipse the high from Sept 20th, 3936.25. In the final four TPO-periods, ES climbed 40-points. The auction stalled at 3973.50, a few points shy of the high from Sept 15th.
Range: 102.75