
11/09/2022 Synopsis
Risk assets struggle as investors await election results and deal with fallout from crypto's contagion. The October CPI figure will be released tomorrow 👀.

Market Overview

Risk assets were pummeled today as every index fell nearly 2% or more. The Dow DIA 0.00%↑ held up the best only falling 1.95%. The S&P 500 SPY 0.00%↑ is now below its 50-day MA once again. Every S&P sector was red with energy XLE 0.00%↑ falling the most. Utilities XLU 0.00%↑ held up the best only falling 0.78%.
The 3-month T-bill held steady while other Treasury yields dropped. The 2-year fell to 4.584 (-1.48%). The 10-year T-note dropped to 4.097% (-0.80%).
The US Dollar index ended a 3-day losing streak. $DXY gained 0.75% to close at $110.44.
The FTX situation has led to the crypto market losing nearly 14%, or $122.64B, in total market cap on the day. Binance announced that after due diligence, it would not be purchasing FTX’s non-US assets. FTT went from a high of $23.88 on Monday to a low of $1.07 today.
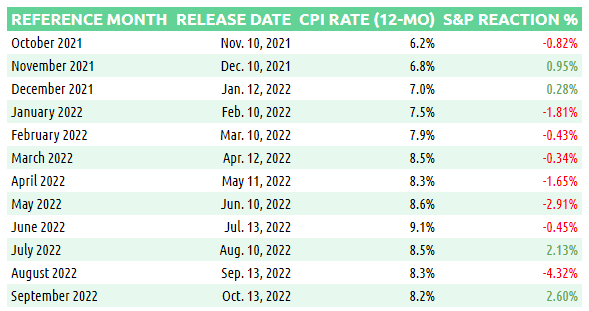
October CPI will be released tomorrow. Below is the S&P’s reaction to the last 12 CPI prints. On average, the S&P fell 0.56%.
Here are some of today’s closing prices.


E-mini S&P 500 Top-Down Analysis

📈 Below are the monthly (5-years), weekly (2-years) and daily (6-months) charts for ES.

M/M: ES is still OTFD but after setting new lows for 2022 it rebounded and finished up 7.8%.
W/W: ES had an outside week in which it traded just above the previous week’s high, as well as below the previous week’s low. It finished down 3.37% and is in balance. ES closed below the 10-week MA.
D/D: ES ended OTFU as it took out the prior day’s low. The next daily low nearby is 3738.25.
E-mini S&P 500 Metrics
Recent Performance & Technicals


E-mini S&P 500 Volume/Market Profile
ES Composite Volume Profile (5 days)
📈 Here is a chart of the past five sessions with a composite ETH Volume Profile:

ES ETH/RTH Split Volume Profile (5 days)
📈 Here is a chart of the past five sessions with a daily ETH/RTH split Volume Profile:

ES ETH/RTH Split Market/Volume Profile (today)
📈 Here’s a TPO chart of today’s session with ETH/RTH split Market/Volume Profile:

ES Market/Volume Profile Levels

RTH Weak High/Low: n/a
RTH Single Prints: 3782.50 to 3785; 3786.50 to 3788.25
RTH Excess: 3750 to 3753.50; 3817 to 3825.75
RTH Gap: n/a
Session Recap
Electronic Trading Hours (ETH)
Globex Session:
Wholesale was long at the prior day’s close. The overnight open was inside of the previous day’s value area. Inventory during the overnight session was mostly short, 52% of the time, inside the prior day’s value area. Demand failed to trade above the previous day’s VAH. Supply failed to accept underneath the VAL. VPOC in the overnight was 3814.75.
Range: 40.25
Regular Trading Hours (RTH)
US Session:
The RTH open was inside of the prior day’s value area by a few points. It was also below the T+2 high. There was supply after the opening bell as ES fell below the overnight low and prior day’s value area. ES came down and failed to take out the previous day’s low, which was in the vicinity of the 10-day 38.2% Fib level and S1. Sellers couldn’t lower the bid under 3795 as buyers were able to absorb supply. ES rallied 30-handles to get back into the previous day’s value area and above the 10-day 50% Fib level before running out of steam. Buyers were unable to lift the offer above 3825.75. Supply pushed ES down 40-points taking out the prior day’s low and S1. Buyers showed up near the 38.2 Fib level to stabilize ES which traded in a 30-point range for the next few hours. In H-period, supply absorbed any remaining bids as buyers faded. ES dropped beneath the 38.2% Fib level and continued to fall 30-points. It took out the T+2 low and S2 and finally caught a bid at 3750. Shorts covered here and ES ended RTH at 3756.25.
Range: 75.75