
11/02/2022 Synopsis
Every index fell as the Fed hiked rates by another 75 basis points. Fed Chair Powell issued hawkish commentary which killed the initial rally by equities following the hike.

Market Overview

Every index fell led by the Nasdaq QQQ 0.00%↑ and Russell IWM 0.00%↑. After a quiet morning, equities rallied initially on the announcement of the Fed 75 bps hike. However, during Fed Chair Powell’s media session, the S&P fell and closed down 3.4% from its intra-day high. The S&P is now below the 50-day MA again. Every S&P sector suffered with consumer discretionary XLY 0.00%↑ falling the most. Utilities XLU 0.00%↑ was the best performing sector, only losing 0.97%.

The 3-month T-bill lost 0.12% while other Treasury yields rose. The 2-year note just missed hitting its previous intraday high. Its yield was up 1.41% to close at 4.613%. The 10-year note gained 1.36% to end the day at 4.101%. The 3-month and 10-year yield curves remain inverted.
The US Dollar index gained 0.51% to close at $112.119 on the day. This index has been steadily rising the past 5-sessions.
Here are some of today’s closing prices.
E-mini S&P 500 Top-Down Analysis

📈 Below are the monthly (5-years), weekly (2-years) and daily (6-months) charts for ES.

M/M: ES is OTFD as it failed to take out the prior month’s high and has traded and closed below the prior month’s low.
W/W: ES is OTFU on a weekly timeframe and has closed above its 10-week MA for the first time since early September.
D/D: ES failed to take out the previous day’s high but fell beneath the low of the past 3-days. 3757.50 and 3736.50 are the next swing lows nearby to the downside.
E-mini S&P 500 Metrics
Recent Performance & Technicals


E-mini S&P 500 Volume/Market Profile
ES Composite Volume Profile (5 days)
📈 Here is a chart of the past five sessions with a composite ETH Volume Profile:
ES ETH/RTH Split Volume Profile (5 days)
📈 Here is a chart of the past five sessions with a daily ETH/RTH split Volume Profile:

ES ETH/RTH Split Market/Volume Profile (today)
📈 Here’s a TPO chart of today’s session with ETH/RTH split Market/Volume Profile:

ES Market/Volume Profile Levels
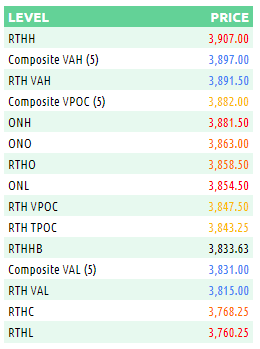
RTH Weak High/Low: n/a
RTH Single Prints: 3772.50 to 3781.25; 3794.25 to 3808.50
RTH Excess: 3760.25 to 3766.75; 3899.50 to 3907
RTH Gap: n/a
Session Recap
Electronic Trading Hours (ETH)
Globex Session:
Wholesale was short at the prior day’s close. The overnight open was inside of the prior day’s value area. Inventory during the overnight session was long. Buyers were trapped in the previous day’s move down so there wasn’t enough demand overnight to absorb those offers. The auction rose above the previous day’s value area momentarily before hitting supply. ES fell beneath VWAP and then corrected short just before the start of RTH.
Range: 27
Regular Trading Hours (RTH)
US Session:
The RTH open was a few ticks below the prior day’s value area and below the T+2 low. There wasn’t much demand at the open so supply dropped the market beneath the overnight and previous day’s low in A-period. At 3840.25, there was some short covering and that buying prevented any further drop as ES consolidated. After trading sideways in a 10-point channel for two hours, supply pushed ES and broke down the channel. ES fell to 3833, momentarily falling below the 50-day MA. Shorts covered here and ES rallied 25-handles. When the Fed’s 75 basis point hike was announced at 2pm, ES jumped 70-points after some initial volatility. It took out the overnight high and got above the prior day’s value area to flip from red to green for the day. During Fed Chair Powell’s commentary, ES failed to rise above 3907. Supply then came crashing onto the market as Powell’s comments were too hawkish for investors. ES went into a freefall. It lost 147-points through the remainder of RTH, bottoming at 3760.25. There were two sets of single prints left on the way down above the close and beneath VPOC.
Range: 146.75
Links
PS - I will be away the rest of the week so there will be no posts until Monday.