
11/01/2022 Synopsis
Equities struggled again ahead of tomorrow's FOMC announcement. JOLTS data released today indicates that the job market remains hot.

Market Overview

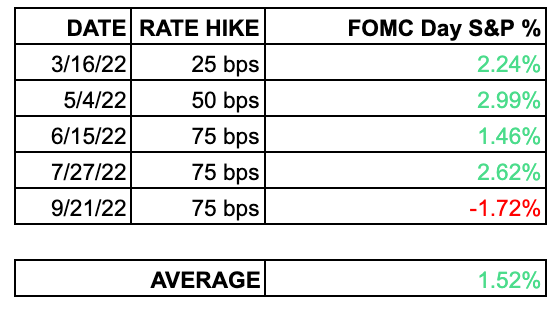
Three of the four major indices were down today with the Nasdaq QQQ 0.00%↑ falling the most. The Russell IWM 0.00%↑ was the only one to finish in the green. Five S&P sectors provided gains, led by energy XLE 0.00%↑. Consumer discretionary XLY 0.00%↑ fared the worst. With the FOMC announcement coming tomorrow, below is how the S&P has fared the day of the Fed’s rate hikes in 2022. The expectation is another 75 bps hike.
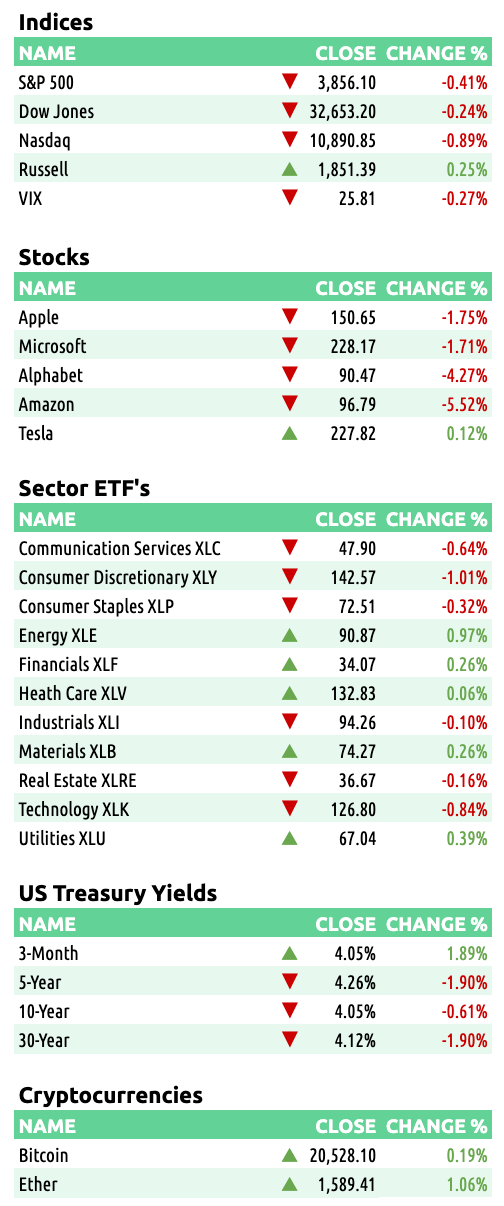
US Treasury yields were mixed. Longer duration treasury notes and bond yields fell. While Treasury bills and shorter duration note yields rose. The 3-month T-bill hit new recent highs and ended the day at 4.05% (+1.38%). The 2-year T-note finished at 4.549% (+1.38%). The 10-year note fell to 4.046% (-0.15%).
The US Dollar index lost 0.03% to end the day at $111.54.
Here are some of today’s closing prices.
E-mini S&P 500 Top-Down Analysis

📈 Below are the monthly (5-years), weekly (2-years) and daily (6-months) charts for ES.

M/M: ES is OTFD as it failed to take out the prior month’s high and has traded and closed below the prior month’s low.
W/W: ES is OTFU on a weekly timeframe and has closed above its 10-week MA for the first time since early September.
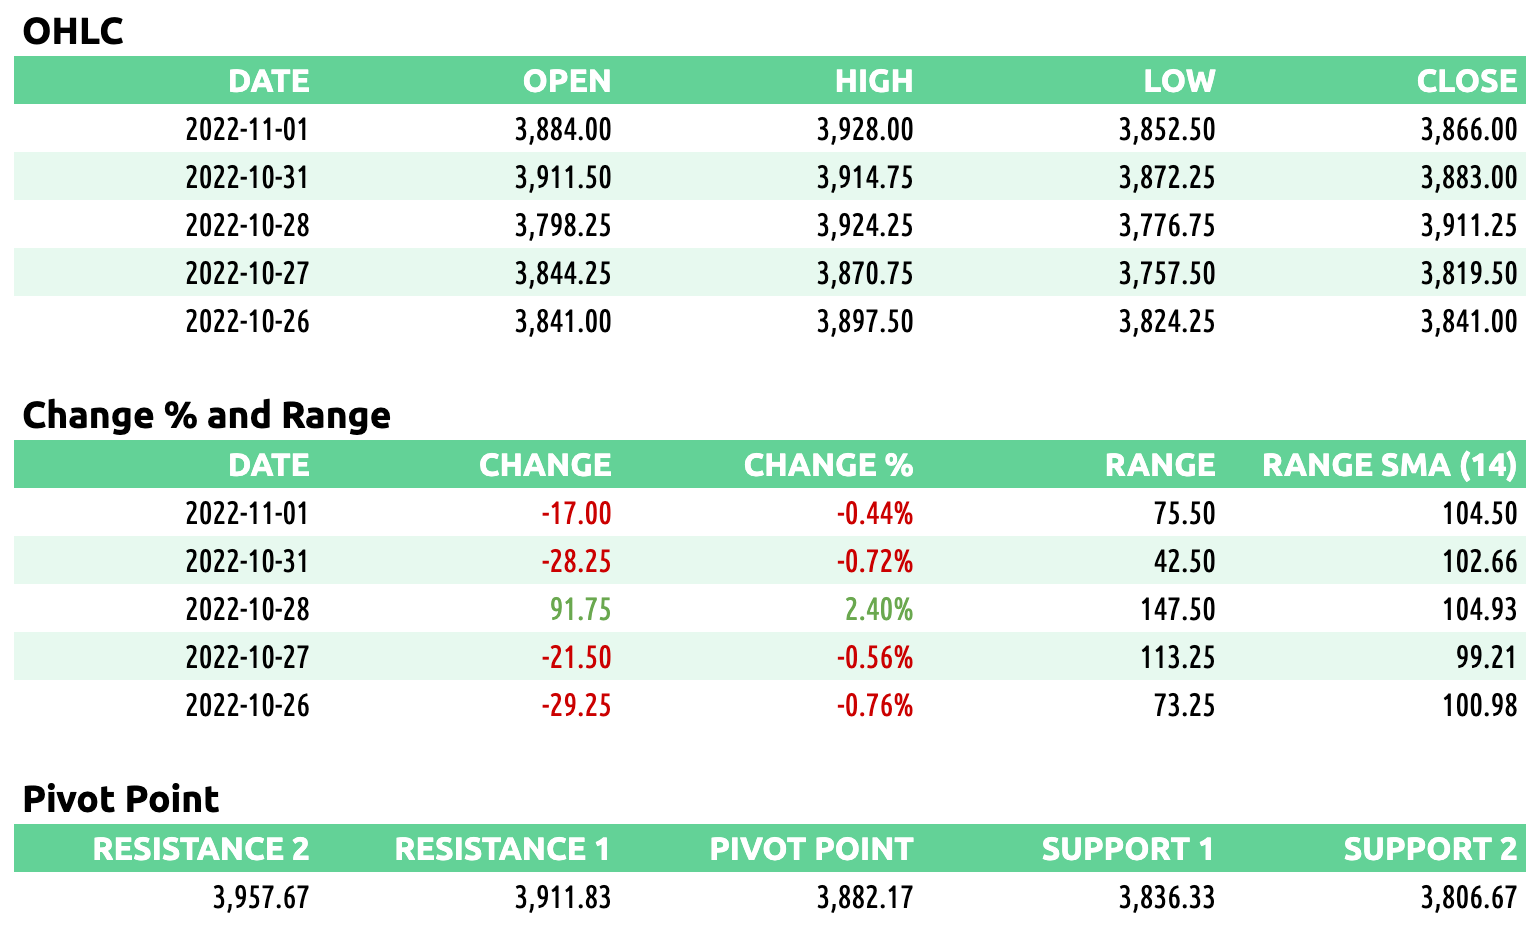
D/D: Similar to the day before the last rate hike, in September, ES had an outside day. It traded above the previous day’s high and below the previous day’s low. Today ES also closed below the prior day’s low.
E-mini S&P 500 Metrics
Recent Performance & Technicals

E-mini S&P 500 Volume/Market Profile
ES Composite Volume Profile (5 days)
📈 Here is a chart of the past five sessions with a composite ETH Volume Profile:

ES ETH/RTH Split Volume Profile (5 days)
📈 Here is a chart of the past five sessions with a daily ETH/RTH split Volume Profile:

ES ETH/RTH Split Market/Volume Profile (today)
📈 Here’s a TPO chart of today’s session with ETH/RTH split Market/Volume Profile:

ES Market/Volume Profile Levels

RTH Weak High/Low: n/a
RTH Single Prints: 3886.5 to 3897.5
RTH Excess: 3852.5 to 3855.5; 3904 to 3924.25
RTH Gap: n/a
Session Recap
Electronic Trading Hours (ETH)
Globex Session:
Wholesale was short at the prior day’s close. The overnight open was inside of the prior day’s value area. In contrast to yesterday, inventory during the overnight session was 100% long. Trapped shorts were propping the market up. Buyers were able to lift ES above the previous day’s high and T+2 high. VPOC in the overnight session was 3922.50.
Range: 47
Regular Trading Hours (RTH)
US Session:
The NY open gapped up and was above the prior day’s high but inside the T+2 high. There was supply at the open and the gap was closed. By the end of A-period, ES had fallen into the prior day’s range and below VWAP. In B-period, more supply dropped ES further to take out the overnight low and the previous day’s low. In the first hour of trading, ES went from plus 1 standard deviation to minus 3 standard deviations. The auction was one time framing down (OTFD) from A to D-period before buyers appeared at 3852.50. Supply shut off and ES stabilized. ES was rangebound below VWAP in a 30-point channel for the remainder of RTH. Long traders were trapped from the sharp move down in the morning which left single prints.
Range: 71.75